Brigantine, NJ (New Jersey) Houses and Residents
| Brigantine: | $481,431 |
| New Jersey: | $428,900 |
Mean price in 2022:
Detached houses: $578,605
Here: $578,605 State: $537,591 Townhouses or other attached units: $491,516
Here: $491,516 State: $381,113 In 2-unit structures: $566,469
Here: $566,469 State: $444,476 In 3-to-4-unit structures: $582,245
Here: $582,245 State: $457,463 In 5-or-more-unit structures: $275,693
Here: $275,693 State: $368,745
Total population: 9,336 (All urban)
Houses: 9,216 (3,758 occupied: 2,704 owner occupied, 1,055 renter occupied)
| % of renters here: | 28% |
| State: | 35% |
Housing density: 1,434 houses/condos per square mile
Median price asked for vacant for-sale houses and condos in 2022: $413,477.
Median contract rent in 2022: $1,244 (lower quartile is $1,053, upper quartile is $1,495)
Median rent asked for vacant for-rent units in 2022: $1,971
Median gross rent in Brigantine, NJ in 2022: $1,521
Housing units in Brigantine with a mortgage: 1,426 (99 second mortgage, 0 home equity loan, 103 both second mortgage and home equity loan)
Houses without a mortgage: 72
Median household income for houses/condos with a mortgage: $134,049
Median household income for apartments without a mortgage: $78,953
Median monthly housing costs: $1,527
Compare current foreclosures near Brigantine, NJ:
| Photo | Address | Area | Beds / Baths | Price | Details |
|---|---|---|---|---|---|

|
#1
Sterling Pl
Brigantine, NJ 08203
|
1,632 sq. feet
|
- baths - beds |
show details | |

|
#2
Georgia Pl
Brigantine, NJ 08203
|
600 sq. feet
|
- baths - beds |
show details | |

|
#3
W Shore Dr
Brigantine, NJ 08203
|
2,192 sq. feet
|
- baths - beds |
show details | |

|
#4
42nd St, Unit A-7
Brigantine, NJ 08203
|
- sq. feet
|
- baths - beds |
show details | |

|
#5
Atlantic Brigantine Blvd
Brigantine, NJ 08203
|
- sq. feet
|
- baths - beds |
show details | |

|
#6
Vardon Cir
Brigantine, NJ 08203
|
2,708 sq. feet
|
- baths - beds |
show details | |

|
#7
Fownes Ave
Brigantine, NJ 08203
|
- sq. feet
|
- baths - beds |
show details | |

|
#8
E Shore Dr
Brigantine, NJ 08203
|
2,764 sq. feet
|
- baths - beds |
show details | |

|
#9
Atlantic Brigantine Blvd
Brigantine, NJ 08203
|
- sq. feet
|
- baths - beds |
show details | |

|
#10
Atlantic Brigantine Blvd Unit 1
Brigantine, NJ 08203
|
- sq. feet
|
- baths - beds |
show details |
| Photo | Address | Area | Beds / Baths | Price | Details |
|---|---|---|---|---|---|

|
#11
2nd St N
Brigantine, NJ 08203
|
1,596 sq. feet
|
- baths - beds |
show details | |

|
#12
Travers Pl
Brigantine, NJ 08203
|
- sq. feet
|
- baths - beds |
show details | |

|
#13
31st St S
Brigantine, NJ 08203
|
2,784 sq. feet
|
- baths - beds |
show details | |

|
#14
Ocean Dr S
Brigantine, NJ 08203
|
- sq. feet
|
- baths - beds |
show details | |

|
#15
Revere Blvd
Brigantine, NJ 08203
|
1,748 sq. feet
|
- baths - beds |
show details | |

|
#16
Lagoon Blvd
Brigantine, NJ 08203
|
1,668 sq. feet
|
- baths - beds |
show details | |

|
#17
Caverly Dr
Brigantine, NJ 08203
|
1,952 sq. feet
|
- baths - beds |
show details | |

|
#18
Caverly Dr
Brigantine, NJ 08203
|
1,864 sq. feet
|
- baths - beds |
show details | |

|
#19
N Connecticut Ave
Atlantic City, NJ 08401
|
1,200 sq. feet
|
1 baths 3 beds |
$139,900
|
show details |

|
#20
Atlantic Brigantine Blvd
Brigantine, NJ 08203
|
- sq. feet
|
- baths - beds |
show details |
| Photo | Address | Area | Beds / Baths | Price | Details |
|---|---|---|---|---|---|

|
#21
42nd A7
Brigantine, NJ 08203
|
- sq. feet
|
- baths - beds |
show details | |

|
#22
Birch Grove Rd
Northfield, NJ 08225
|
- sq. feet
|
1 baths 3 beds |
$249,900
|
show details |

|
#23
N Ohio Ave
Atlantic City, NJ 08401
|
3,320 sq. feet
|
4 baths 6 beds |
show details | |

|
#24
Brown Ave
Egg Harbor Township, NJ 08234
|
- sq. feet
|
- baths - beds |
$67,900
|
show details |

|
#25
N 4th St
Pleasantville, NJ 08232
|
1,128 sq. feet
|
1 baths 2 beds |
show details | |

|
#26
W Adams Ave
Pleasantville, NJ 08232
|
1,314 sq. feet
|
1 baths 3 beds |
show details | |

|
#27
Country Ln
Absecon, NJ 08205
|
1,722 sq. feet
|
2 baths 3 beds |
show details | |

|
#28
Martin Ter
Pleasantville, NJ 08232
|
1,436 sq. feet
|
1 baths 3 beds |
show details | |

|
#29
Chicago Ave
Egg Harbor City, NJ 08215
|
1,185 sq. feet
|
2 baths 3 beds |
show details | |

|
#30
E Mourning Dove Way
Absecon, NJ 08205
|
2,324 sq. feet
|
2 baths 4 beds |
show details |
| Photo | Address | Area | Beds / Baths | Price | Details |
|---|---|---|---|---|---|

|
#31
Imperial Dr
Egg Harbor Township, NJ 08234
|
3,020 sq. feet
|
3 baths 5 beds |
show details | |

|
#32
Florida Ave
Egg Harbor Township, NJ 08234
|
1,008 sq. feet
|
1 baths 3 beds |
show details | |

|
#33
Drexel Ave
Atlantic City, NJ 08401
|
- sq. feet
|
- baths - beds |
$6,900
|
show details |

|
#34
W Rene Ave
Egg Harbor City, NJ 08215
|
1,088 sq. feet
|
1 baths 3 beds |
show details | |

|
#35
Robert Best Rd
Egg Harbor Township, NJ 08234
|
1,508 sq. feet
|
2 baths 3 beds |
show details | |

|
#36
Poplar Ave
Absecon, NJ 08205
|
2,212 sq. feet
|
2 baths 4 beds |
show details | |

|
#37
Old Church Rd
Egg Harbor City, NJ 08215
|
2,134 sq. feet
|
2 baths 4 beds |
show details | |

|
#38
W Mullica Rd
Tuckerton, NJ 08087
|
1,024 sq. feet
|
1 baths 3 beds |
show details | |

|
#39
Washington Ave
Egg Harbor City, NJ 08215
|
1,807 sq. feet
|
2 baths 4 beds |
show details | |

|
#40
Treetop Ln
Egg Harbor Township, NJ 08234
|
2,616 sq. feet
|
3 baths 4 beds |
show details |
| Photo | Address | Area | Beds / Baths | Price | Details |
|---|---|---|---|---|---|

|
#41
Federal Ct
Absecon, NJ 08205
|
- sq. feet
|
2 baths 2 beds |
show details | |

|
#42
N Maple Ave
Tuckerton, NJ 08087
|
- sq. feet
|
- baths - beds |
$400,000
|
show details |

|
#43
Fairwa 1625
Absecon, NJ 08205
|
1,173 sq. feet
|
- baths - beds |
show details | |

|
#44
Ocean Heights Ave
Mays Landing, NJ 08330
|
- sq. feet
|
2 baths 4 beds |
show details | |

|
#45
S New Rd
Pleasantville, NJ 08232
|
496 sq. feet
|
- baths - beds |
show details | |

|
#46
Woodland Ave
Pleasantville, NJ 08232
|
1,434 sq. feet
|
- baths - beds |
show details | |

|
#47
Saratoga Lake Dr
Tuckerton, NJ 08087
|
1,208 sq. feet
|
- baths - beds |
show details | |

|
#48
Martin L King Ave
Egg Harbor Township, NJ 08234
|
1,008 sq. feet
|
- baths - beds |
show details | |

|
#49
Rushwood Dr
Egg Harbor Township, NJ 08234
|
1,679 sq. feet
|
- baths - beds |
show details | |

|
Check over 1 million property listings on Foreclosure.com!
|
browse all offers | |||

Latest news about housing in Brigantine, NJ collected exclusively by city-data.com from local newspapers, TV, and radio stations

 | Brigantine beach house rental - safe area? (7 replies) |
| Best Website For Shore Rentals (22 replies) |
| I am trying to sell a house in Brigantine NJ- Any ideas? (18 replies) |
| Trying to sell a house in Brigantine NJ - Any Ideas? (3 replies) |
| Brigantine, nj vacation condos (2 replies) |
| Apartment Homes not far from A.C. (3 replies) |

Median year apartment built: 1976
Household type by relationship:
Households: 7,820- Male householders: 1,932 (390 living alone), Female householders: 1,833 (855 living alone)
1,725 spouses (1,719 opposite-sex spouses), 391 unmarried partners, (375 opposite-sex unmarried partners), 1,375 children (1,289 natural, 37 adopted, 49 stepchildren), 228 grandchildren, 65 brothers or sisters, 53 parents, 0 foster children, 81 other relatives, 129 non-relatives
- In group quarters: 5
Size of family households: 1,310 2-persons, 526 3-persons, 351 4-persons, 15 5-persons, 36 6-persons, 17 7-or-more-persons.
Size of nonfamily households: 1,207 1-person, 275 2-persons, 21 3-persons.
465 married couples with children.
118 single-parent households (66 men, 52 women).
86.7% of residents of Brigantine speak English at home.
5.3% of residents speak Spanish at home (79% speak English very well, 5% speak English well, 3% speak English not well, 12% don't speak English at all).
5.5% of residents speak other Indo-European language at home (71% speak English very well, 27% speak English well, 3% speak English not well).
2.0% of residents speak Asian or Pacific Island language at home (100% speak English very well).
1.2% of residents speak other language at home (77% speak English very well, 23% speak English well).
Foreign born population: 557 (7.1%)
(72.9% of them are naturalized citizens)
| Here: | 6.0 |
| State: | 6.8 |
| Here: | 4.4 |
| State: | 3.9 |

- Bedrooms in owner-occupied houses and condos in Brigantine, New Jersey
- 0no bedroom
- 1121 bedroom
- 4992 bedrooms
- 1,3703 bedrooms
- 4804 bedrooms
- 2435+ bedrooms

- Bedrooms in renter-occupied apartments in Brigantine, New Jersey
- 38no bedroom
- 1541 bedroom
- 5272 bedrooms
- 2363 bedrooms
- 884 bedrooms
- 125+ bedrooms

- Cars and other vehicles available in Brigantine in owner-occupied houses/condos
- 112no vehicle
- 9201 vehicle
- 1,2722 vehicles
- 3253 vehicles
- 664 vehicles
- 95+ vehicles

- Cars and other vehicles available in Brigantine in renter-occupied apartments
- 119no vehicle
- 4931 vehicle
- 3712 vehicles
- 723 vehicles
- 04 vehicles
- 05+ vehicles

- Rooms in owner-occupied houses in Brigantine, New Jersey
- 01 room
- 342 rooms
- 1263 rooms
- 3864 rooms
- 5025 rooms
- 5106 rooms
- 5407 rooms
- 4068 rooms
- 2019+ rooms

- Rooms in renter-occupied apartments in Brigantine, New Jersey
- 191 room
- 532 rooms
- 1123 rooms
- 3844 rooms
- 1975 rooms
- 1266 rooms
- 457 rooms
- 648 rooms
- 549+ rooms


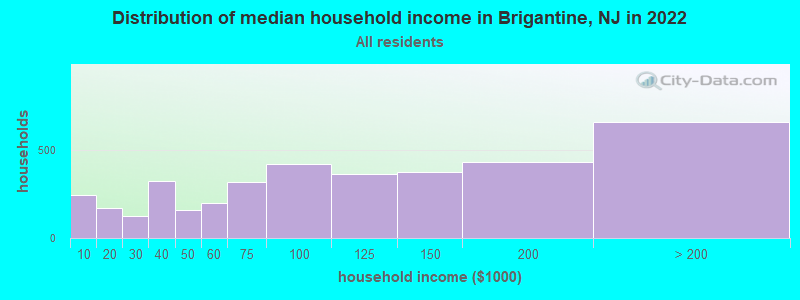
Brigantine, NJ household income distribution

- 242Less than $10,000
- 170$10,000 to $19,999
- 125$20,000 to $29,999
- 321$30,000 to $39,999
- 159$40,000 to $49,999
- 196$50,000 to $59,999
- 317$60,000 to $74,999
- 417$75,000 to $99,999
- 364$100,000 to $124,999
- 377$125,000 to $149,999
- 431$150,000 to $199,999
- 658$200,000 or more
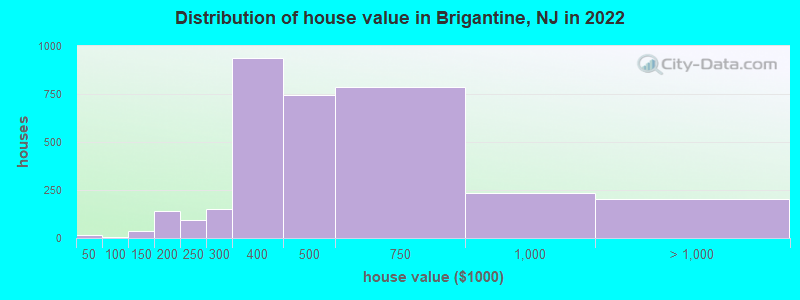
Home value of owner - occupied houses in 2022 in Brigantine, NJ
-
- 8$30,000 to $34,999
- 6$40,000 to $49,999
- 10$100,000 to $124,999
- 26$125,000 to $149,999
- 54$150,000 to $174,999
- 87$175,000 to $199,999
- 96$200,000 to $249,999
- 150$250,000 to $299,999
- 937$300,000 to $399,999
- 745$400,000 to $499,999
- 788$500,000 to $749,999
- 232$750,000 to $999,999
- 173$1,000,000 to $1,499,999
- 13$1,500,000 to $1,999,999
- 17$2,000,000 or more
Rent paid by renters in 2022 in Brigantine, NJ
-
- 5$350 to $399
- 5$450 to $499
- 5$550 to $599
- 14$600 to $649
- 2$700 to $749
- 50$750 to $799
- 45$800 to $899
- 48$900 to $999
- 318$1,000 to $1,249
- 251$1,250 to $1,499
- 152$1,500 to $1,999
- 40$2,000 to $2,499
- 5$2,500 to $2,999
- 35$3,500 or more
- 28No cash rent


Percentage of workers working in this county: 76.1%
Number of people working at home: 841 (21.1% of all workers)
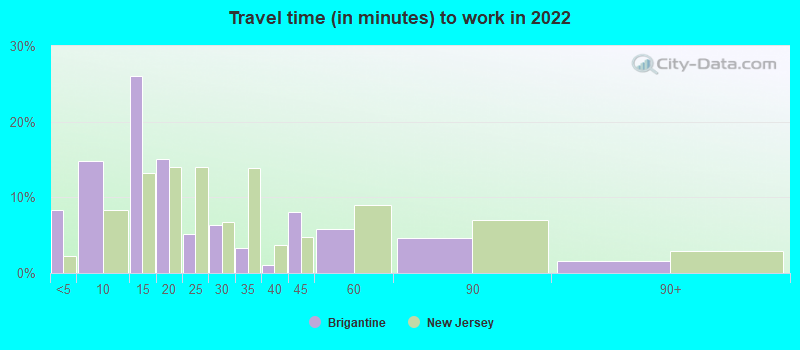
Travel time to work (commute)
- Less than 5 minutes: 142
- 5 to 9 minutes: 345
- 10 to 14 minutes: 696
- 15 to 19 minutes: 436
- 20 to 24 minutes: 384
- 25 to 29 minutes: 385
- 30 to 34 minutes: 291
- 35 to 39 minutes: 0
- 40 to 44 minutes: 77
- 45 to 59 minutes: 110
- 60 to 89 minutes: 250
- 90 or more minutes: 162
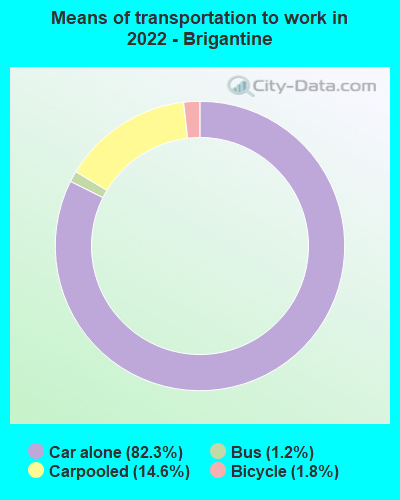
Means of transportation to work:
- Drove a car alone: 1,231 (56.4%)
- Carpooled: 247 (11.3%)
- Bus: 16 (0.7%)
- Bicycle: 27 (1.2%)
- Walked: 1 (0.0%)
- Worked at home: 841 (38.5%)

- Unemployment by race in 2022
- Unemployment rate for White non-Hispanic residents
- 1.4%Males
- 4.5%Females
- Unemployment rate for other race residents
- 11.8%Males
- 17.2%Females
- Unemployment rate for Hispanic or Latino residents
- 7.9%Males
- 9.8%Females

- Year of entry for the foreign-born population in Brigantine, New Jersey
- 672010 or later
- 2132000 to 2009
- 1281990 to 1999
- 2971980 to 1989
- 1531970 to 1979
- 303Before 1970

First ancestries reported:
- Italian: 1,182 (28.6%)
- Irish: 971 (23.5%)
- American: 215 (5.2%)
- English: 195 (4.7%)
- Polish: 173 (4.2%)
- Ukrainian: 108 (2.6%)
- German: 89 (2.2%)
- Armenian: 78 (1.9%)
- Greek: 61 (1.5%)
- Moroccan: 38 (0.9%)
- Hungarian: 36 (0.9%)
- European: 33 (0.8%)
- Bulgarian: 24 (0.6%)
- Slovak: 24 (0.6%)
- Lithuanian: 19 (0.5%)
- Scotch-Irish: 17 (0.4%)
- Welsh: 16 (0.4%)
- French: 15 (0.4%)
- Russian: 13 (0.3%)
- British: 11 (0.3%)
- Danish: 11 (0.3%)
- Albanian: 9 (0.2%)
- Egyptian: 9 (0.2%)
- Scottish: 9 (0.2%)
- Austrian: 7 (0.2%)
- Dutch: 7 (0.2%)
- Romanian: 4 (0.10%)
- Swiss: 4 (0.10%)
- Czech: 3 (0.07%)
- French Canadian: 3 (0.07%)
- Northern European: 3 (0.07%)
Most common places of birth for foreign-born residents (%):
| Brigantine: | 28.4% (174) |
| New Jersey: | 12.8% (274,609) |
| Brigantine: | 12.9% (79) |
| New Jersey: | 1.3% (27,580) |
| Brigantine: | 6.2% (38) |
| New Jersey: | 3.7% (78,969) |
| Brigantine: | 5.5% (34) |
| New Jersey: | 3.3% (70,512) |
| Brigantine: | 4.7% (29) |
| New Jersey: | 4.2% (90,817) |
| Brigantine: | 4.4% (27) |
| New Jersey: | 4.0% (85,934) |
| Brigantine: | 3.4% (21) |
| New Jersey: | 0.6% (12,793) |
| Brigantine: | 3.3% (20) |
| New Jersey: | 0.2% (3,249) |
| Brigantine: | 3.3% (20) |
| New Jersey: | 1.5% (33,198) |
| Brigantine: | 2.9% (18) |
| New Jersey: | 0.2% (4,659) |
| Brigantine: | 2.9% (18) |
| New Jersey: | 4.4% (95,275) |
| Brigantine: | 2.4% (15) |
| New Jersey: | 0.2% (4,324) |
| Brigantine: | 1.6% (10) |
| New Jersey: | 9.7% (209,055) |
Place of birth for U.S.-born residents:
- This state: 3,426
- Other state: 3,652
- Northeast: 2,778
- Midwest: 114
- South: 496
- West: 183
87.4% of Brigantine residents lived in the same house 1 years ago.
Out of people who lived in different houses, 31.2% lived in this county.
Out of people who lived in different counties, 63.9% lived in New Jersey.
| Brigantine: | 87.4% |
| State average: | 90.4% |
Education attainment for males 25 years and older:
- No schooling: 112
- Nursery to 4th grade: 22
- 5th and 6th grade: 11
- 7th and 8th grade: 10
- 9th grade: 8
- 10th grade: 0
- 11th grade: 17
- 12th grade, no diploma: 20
- High school graduate (or equivalency): 594
- Less than 1 year of college: 220
- Some college more than 1 year, no degree: 419
- Associate degree: 235
- Bachelor's degree: 770
- Master's degree: 392
- Professional school degree: 107
- Doctorate degree: 111

Education attainment for females 25 years and older:
- No schooling: 113
- Nursery to 4th grade: 0
- 5th and 6th grade: 20
- 7th and 8th grade: 20
- 9th grade: 86
- 10th grade: 37
- 11th grade: 50
- 12th grade, no diploma: 31
- High school graduate (or equivalency): 816
- Less than 1 year of college: 202
- Some college more than 1 year, no degree: 400
- Associate degree: 173
- Bachelor's degree: 1,053
- Master's degree: 487
- Professional school degree: 136
- Doctorate degree: 63


Housing units in structures:
- One, detached: 4,614
- One, attached: 1,342
- Two: 858
- 3 or 4: 680
- 5 to 9: 244
- 10 to 19: 469
- 20 to 49: 391
- 50 or more: 614
House/condo owner moved in on average 14 years ago
Renter moved in on average 6 years ago

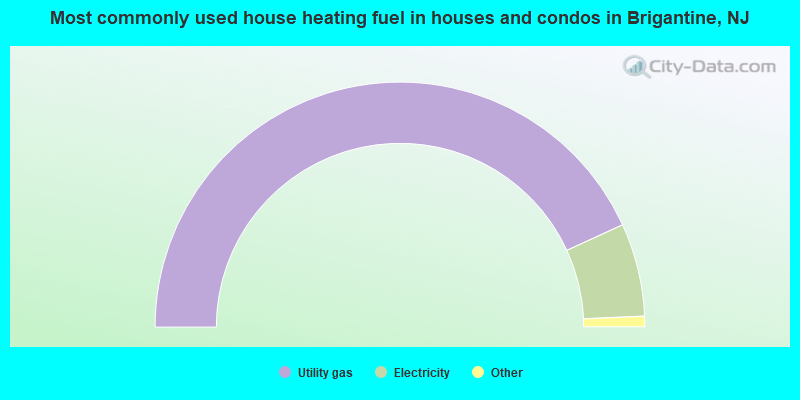
- 86.3%Utility gas
- 12.3%Electricity
- 0.9%Fuel oil, kerosene, etc.
- 0.3%Solar energy
- 0.2%Wood
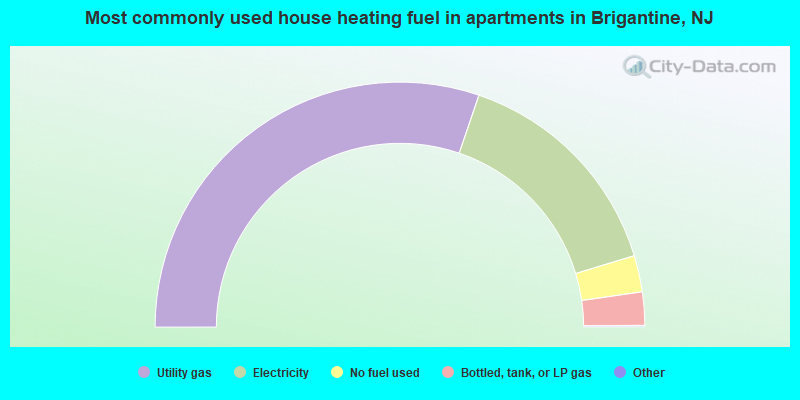
- 60.6%Utility gas
- 30.2%Electricity
- 4.8%No fuel used
- 4.4%Bottled, tank, or LP gas
Private vs. public school enrollment:
| Here: | 7.4% |
| New Jersey: | 12.3% |
| Here: | 0.0% |
| New Jersey: | 13.1% |
| Here: | 8.8% |
| New Jersey: | 33.2% |


