Bridgeton, NJ (New Jersey) Houses and Residents
| Bridgeton: | $137,174 |
| New Jersey: | $428,900 |
Mean price in 2022:
Detached houses: $203,173
Here: $203,173 State: $537,591 Townhouses or other attached units: $120,325
Here: $120,325 State: $381,113 In 2-unit structures: $131,809
Here: $131,809 State: $444,476 Mobile homes: $175,609
Here: $175,609 State: $119,788
Total population: 25,347 (Urban population: 22,771 (all inside urban clusters), Rural population: 0)
Houses: 7,654 (6,931 occupied: 2,722 owner occupied, 4,507 renter occupied)
| % of renters here: | 62% |
| State: | 35% |
Housing density: 1,230 houses/condos per square mile
Median price asked for vacant for-sale houses and condos in 2022: $778,215.
Median contract rent in 2022: $895 (lower quartile is $522, upper quartile is $1,147)
Median rent asked for vacant for-rent units in 2022: $550
Median gross rent in Bridgeton, NJ in 2022: $1,159
Housing units in Bridgeton with a mortgage: 1,606 (72 second mortgage, 17 home equity loan, 41 both second mortgage and home equity loan)
Houses without a mortgage: 2
Median household income for houses/condos with a mortgage: $68,187
Median household income for apartments without a mortgage: $57,308
Median monthly housing costs: $1,155
Compare current foreclosures in Bridgeton, NJ:
| Photo | Address | Area | Beds / Baths | Price | Details |
|---|---|---|---|---|---|

|
#1
Cumberland Ave
Bridgeton, NJ 08302
|
1,288 sq. feet
|
2 baths 3 beds |
show details | |

|
#2
Coral Ave
Bridgeton, NJ 08302
|
1,196 sq. feet
|
2 baths 3 beds |
show details | |

|
#3
Fordville Rd
Bridgeton, NJ 08302
|
880 sq. feet
|
1 baths 3 beds |
show details | |

|
#4
S Lawrence St
Bridgeton, NJ 08302
|
1,352 sq. feet
|
2 baths 3 beds |
show details | |

|
#5
York St
Bridgeton, NJ 08302
|
908 sq. feet
|
1 baths 2 beds |
show details | |

|
#6
Division St
Bridgeton, NJ 08302
|
1,006 sq. feet
|
1 baths 3 beds |
show details | |

|
#7
Spring St
Bridgeton, NJ 08302
|
1,441 sq. feet
|
1 baths 4 beds |
show details | |

|
#8
East Ave
Bridgeton, NJ 08302
|
1,344 sq. feet
|
- baths - beds |
show details | |

|
#9
Fairton Gouldtown Rd
Bridgeton, NJ 08302
|
720 sq. feet
|
- baths - beds |
show details | |

|
#10
Watson Ln
Bridgeton, NJ 08302
|
896 sq. feet
|
- baths - beds |
show details |
| Photo | Address | Area | Beds / Baths | Price | Details |
|---|---|---|---|---|---|

|
#11
Finlaw Ave
Bridgeton, NJ 08302
|
940 sq. feet
|
- baths - beds |
show details | |

|
#12
Cohansey Friesburg Rd
Bridgeton, NJ 08302
|
- sq. feet
|
- baths - beds |
show details | |

|
#13
Husted Station Rd
Bridgeton, NJ 08302
|
1,100 sq. feet
|
- baths - beds |
show details | |

|
#14
Coral Ave
Bridgeton, NJ 08302
|
- sq. feet
|
- baths - beds |
show details | |

|
#15
Vilms St
Bridgeton, NJ 08302
|
- sq. feet
|
- baths - beds |
show details | |

|
#16
Vickers Ave
Bridgeton, NJ 08302
|
1,637 sq. feet
|
- baths - beds |
show details | |

|
#17
Finlaw Ave
Bridgeton, NJ 08302
|
940 sq. feet
|
- baths - beds |
show details | |

|
#18
Colonial Ter
Bridgeton, NJ 08302
|
- sq. feet
|
- baths - beds |
show details | |

|
#19
Columbia Hwy
Bridgeton, NJ 08302
|
1,104 sq. feet
|
- baths - beds |
show details | |

|
#20
Deerfield Dr
Bridgeton, NJ 08302
|
- sq. feet
|
- baths - beds |
show details |
| Photo | Address | Area | Beds / Baths | Price | Details |
|---|---|---|---|---|---|

|
#21
Telegraph Rd
Bridgeton, NJ 08302
|
3,924 sq. feet
|
- baths - beds |
show details | |

|
#22
Preston Ave
Bridgeton, NJ 08302
|
1,188 sq. feet
|
- baths - beds |
show details | |

|
#23
Hannon Rd
Bridgeton, NJ 08302
|
- sq. feet
|
- baths - beds |
show details | |

|
#24
Macarthur Dr
Bridgeton, NJ 08302
|
- sq. feet
|
- baths - beds |
show details | |

|
#25
Centerton Rd
Bridgeton, NJ 08302
|
1,220 sq. feet
|
- baths - beds |
show details | |

|
#26
Finlaw Ave
Bridgeton, NJ 08302
|
- sq. feet
|
- baths - beds |
show details | |

|
#27
Edward Ave
Bridgeton, NJ 08302
|
1,436 sq. feet
|
- baths - beds |
show details | |

|
#28
Greenwich Rd
Bridgeton, NJ 08302
|
899 sq. feet
|
- baths - beds |
show details | |

|
#29
Oakview Hts
Bridgeton, NJ 08302
|
- sq. feet
|
- baths - beds |
show details | |

|
#30
Central Ave Apt 22
Bridgeton, NJ 08302
|
- sq. feet
|
- baths - beds |
show details |
| Photo | Address | Area | Beds / Baths | Price | Details |
|---|---|---|---|---|---|

|
#31
George St
Bridgeton, NJ 08302
|
1,092 sq. feet
|
- baths - beds |
show details | |

|
#32
Briarwood Ln
Bridgeton, NJ 08302
|
- sq. feet
|
- baths - beds |
show details | |

|
#33
Cobbs Mill Rd
Bridgeton, NJ 08302
|
1,984 sq. feet
|
- baths - beds |
show details | |

|
#34
East Ave
Bridgeton, NJ 08302
|
- sq. feet
|
- baths - beds |
show details | |

|
#35
Krysta Ct
Bridgeton, NJ 08302
|
- sq. feet
|
- baths - beds |
show details | |

|
#36
Bank St
Bridgeton, NJ 08302
|
- sq. feet
|
- baths - beds |
show details | |

|
#37
Institute Pl
Bridgeton, NJ 08302
|
2,289 sq. feet
|
- baths - beds |
show details | |

|
#38
Silver Lake Rd
Bridgeton, NJ 08302
|
- sq. feet
|
- baths - beds |
show details | |

|
#39
Meadow Wood Dr
Bridgeton, NJ 08302
|
1,421 sq. feet
|
- baths - beds |
show details | |

|
#40
Lebanon Rd
Bridgeton, NJ 08302
|
1,954 sq. feet
|
- baths - beds |
show details |
| Photo | Address | Area | Beds / Baths | Price | Details |
|---|---|---|---|---|---|

|
#41
Mary Elmer Dr
Bridgeton, NJ 08302
|
1,196 sq. feet
|
- baths - beds |
show details | |

|
#42
And 508 Centerton Rd
Bridgeton, NJ 08302
|
- sq. feet
|
- baths - beds |
show details | |

|
#43
Lebanon Rd
Bridgeton, NJ 08302
|
912 sq. feet
|
- baths - beds |
show details | |

|
#44
Friesburg Rd
Bridgeton, NJ 08302
|
1,262 sq. feet
|
- baths - beds |
show details | |

|
#45
Clarks Pond Rd
Bridgeton, NJ 08302
|
1,100 sq. feet
|
- baths - beds |
show details | |

|
#46
Violet Dr
Bridgeton, NJ 08302
|
- sq. feet
|
- baths - beds |
show details | |

|
#47
Barretts Run Rd
Bridgeton, NJ 08302
|
728 sq. feet
|
- baths - beds |
show details | |

|
#48
Cobbs Mill Rd
Bridgeton, NJ 08302
|
1,248 sq. feet
|
- baths - beds |
show details | |

|
#49
East Ave
Bridgeton, NJ 08302
|
- sq. feet
|
- baths - beds |
show details | |

|
Check over 1 million property listings on Foreclosure.com!
|
browse all offers | |||

Latest news about housing in Bridgeton, NJ collected exclusively by city-data.com from local newspapers, TV, and radio stations

 | Where can I find apartments in Central NJ to rent for $500 or less? (24 replies) |
| Under Contract on a home in Upper Deerfield/Bridgeton - Are we crazy? (9 replies) |
| vineland (13 replies) |
| Quasi-relocation - where to move in South Jersey? (4 replies) |
| Buffet etiquette NYC vs NJ (64 replies) |
| The so called bad towns in New Jersey? (Alphabetical Order) (88 replies) |

Median year apartment built: 1959
Household type by relationship:
Households: 26,504- Male householders: 3,045 (714 living alone), Female householders: 3,772 (1,108 living alone)
1,889 spouses (1,889 opposite-sex spouses), 974 unmarried partners, (967 opposite-sex unmarried partners), 9,436 children (8,650 natural, 142 adopted, 643 stepchildren), 724 grandchildren, 632 brothers or sisters, 291 parents, 0 foster children, 644 other relatives, 1,287 non-relatives
- In group quarters: 3,805
Size of family households: 1,038 2-persons, 1,061 3-persons, 1,217 4-persons, 892 5-persons, 317 6-persons, 298 7-or-more-persons.
Size of nonfamily households: 1,842 1-person, 520 2-persons, 13 3-persons, 24 4-persons.
2,706 married couples with children.
4,132 single-parent households (1,248 men, 2,884 women).
51.2% of residents of Bridgeton speak English at home.
47.8% of residents speak Spanish at home (39% speak English very well, 18% speak English well, 25% speak English not well, 18% don't speak English at all).
1.2% of residents speak other Indo-European language at home (57% speak English very well, 25% speak English well, 18% speak English not well).
0.3% of residents speak Asian or Pacific Island language at home (71% speak English very well, 29% speak English well).
0.3% of residents speak other language at home (63% speak English very well, 32% speak English well, 5% speak English not well).
Foreign born population: 6,226 (23.5%)
(15.1% of them are naturalized citizens)
| Here: | 6.0 |
| State: | 6.8 |
| Here: | 4.8 |
| State: | 3.9 |

- Bedrooms in owner-occupied houses and condos in Bridgeton, New Jersey
- 18no bedroom
- 391 bedroom
- 6542 bedrooms
- 1,2893 bedrooms
- 6074 bedrooms
- 1165+ bedrooms

- Bedrooms in renter-occupied apartments in Bridgeton, New Jersey
- 108no bedroom
- 1,0211 bedroom
- 1,3002 bedrooms
- 1,5713 bedrooms
- 3784 bedrooms
- 1305+ bedrooms

- Cars and other vehicles available in Bridgeton in owner-occupied houses/condos
- 78no vehicle
- 1,0041 vehicle
- 9692 vehicles
- 4823 vehicles
- 1264 vehicles
- 635+ vehicles

- Cars and other vehicles available in Bridgeton in renter-occupied apartments
- 1,130no vehicle
- 2,3091 vehicle
- 8112 vehicles
- 2133 vehicles
- 454 vehicles
- 05+ vehicles

- Rooms in owner-occupied houses in Bridgeton, New Jersey
- 181 room
- 02 rooms
- 113 rooms
- 2764 rooms
- 4475 rooms
- 7686 rooms
- 4257 rooms
- 2828 rooms
- 4949+ rooms

- Rooms in renter-occupied apartments in Bridgeton, New Jersey
- 931 room
- 472 rooms
- 7023 rooms
- 7094 rooms
- 1,1415 rooms
- 1,1236 rooms
- 4207 rooms
- 738 rooms
- 2009+ rooms


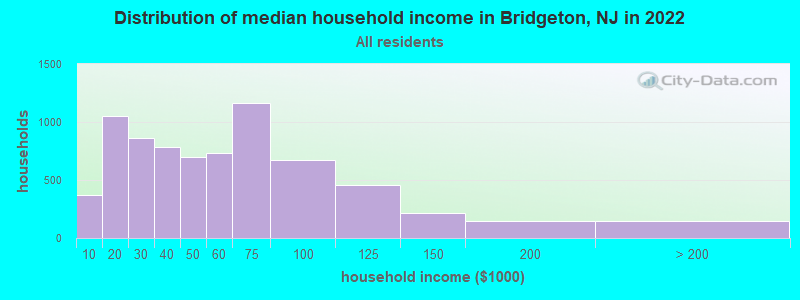
Bridgeton, NJ household income distribution

- 372Less than $10,000
- 1,051$10,000 to $19,999
- 866$20,000 to $29,999
- 786$30,000 to $39,999
- 694$40,000 to $49,999
- 734$50,000 to $59,999
- 1,163$60,000 to $74,999
- 675$75,000 to $99,999
- 460$100,000 to $124,999
- 212$125,000 to $149,999
- 146$150,000 to $199,999
- 146$200,000 or more
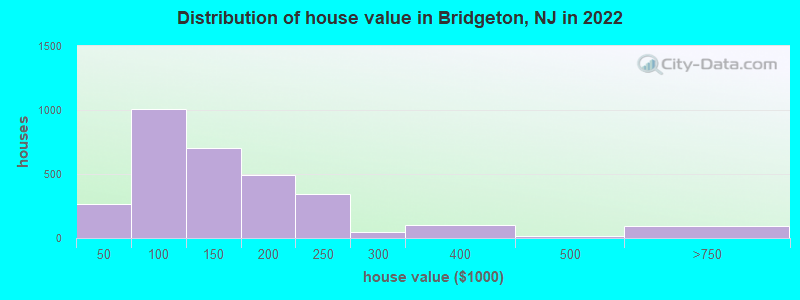
Home value of owner - occupied houses in 2022 in Bridgeton, NJ
-
- 6Less than $10,000
- 32$15,000 to $19,999
- 3$20,000 to $24,999
- 32$25,000 to $29,999
- 6$30,000 to $34,999
- 124$35,000 to $39,999
- 58$40,000 to $49,999
- 58$50,000 to $59,999
- 267$60,000 to $69,999
- 156$70,000 to $79,999
- 186$80,000 to $89,999
- 283$90,000 to $99,999
- 243$100,000 to $124,999
- 463$125,000 to $149,999
- 414$150,000 to $174,999
- 75$175,000 to $199,999
- 343$200,000 to $249,999
- 44$250,000 to $299,999
- 99$300,000 to $399,999
- 12$400,000 to $499,999
- 81$500,000 to $749,999
- 4$750,000 to $999,999
- 8$1,000,000 to $1,499,999
Rent paid by renters in 2022 in Bridgeton, NJ
-
- 37Less than $100
- 68$100 to $149
- 96$150 to $199
- 95$200 to $249
- 212$250 to $299
- 86$300 to $349
- 275$350 to $399
- 127$400 to $449
- 44$450 to $499
- 125$500 to $549
- 16$550 to $599
- 129$600 to $649
- 69$700 to $749
- 242$750 to $799
- 625$800 to $899
- 544$900 to $999
- 809$1,000 to $1,249
- 550$1,250 to $1,499
- 21$1,500 to $1,999
- 89$2,000 to $2,499
- 35$3,000 to $3,499
- 65No cash rent


Percentage of workers working in this county: 67.0%
Number of people working at home: 343 (3.8% of all workers)
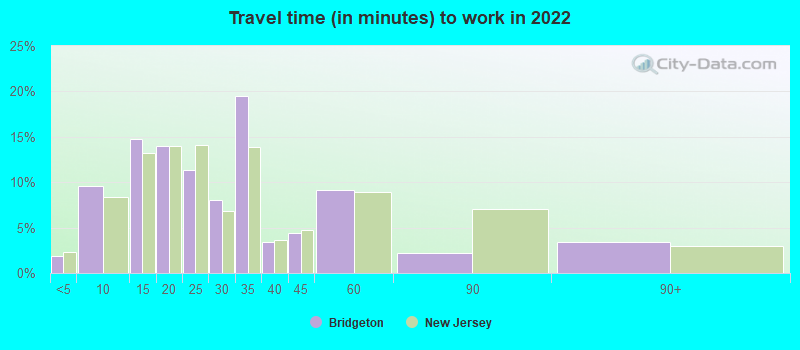
Travel time to work (commute)
- Less than 5 minutes: 173
- 5 to 9 minutes: 757
- 10 to 14 minutes: 785
- 15 to 19 minutes: 738
- 20 to 24 minutes: 1,440
- 25 to 29 minutes: 426
- 30 to 34 minutes: 1,629
- 35 to 39 minutes: 77
- 40 to 44 minutes: 564
- 45 to 59 minutes: 687
- 60 to 89 minutes: 931
- 90 or more minutes: 153
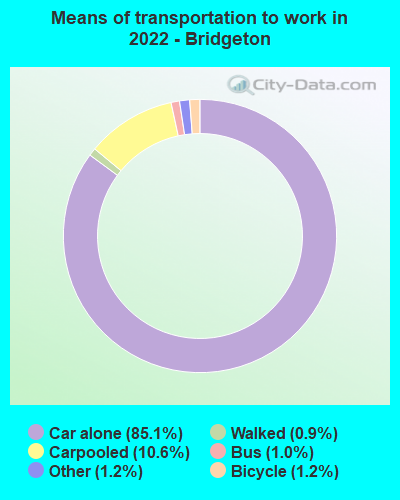
Means of transportation to work:
- Drove a car alone: 6,485 (77.0%)
- Carpooled: 927 (11.0%)
- Bus: 74 (0.9%)
- Taxi: 109 (1.3%)
- Bicycle: 99 (1.2%)
- Walked: 85 (1.0%)
- Worked at home: 343 (4.1%)

- Unemployment by race in 2022
- Unemployment rate for White non-Hispanic residents
- 15.5%Males
- Unemployment rate for Black residents
- 1.3%Males
- 21.5%Females
- Unemployment rate for other race residents
- 0.4%Males
- 3.1%Females
- Unemployment rate for two or more race residents
- 8.4%Males
- 5.5%Females
- Unemployment rate for Hispanic or Latino residents
- 5.0%Males
- 3.0%Females

- Year of entry for the foreign-born population in Bridgeton, New Jersey
- 2,0602010 or later
- 2,6362000 to 2009
- 8761990 to 1999
- 5851980 to 1989
- 1651970 to 1979
- 146Before 1970

First ancestries reported:
- American: 346 (1.7%)
- Italian: 324 (1.6%)
- Jamaican: 259 (1.3%)
- Haitian: 197 (1.0%)
- German: 158 (0.8%)
- English: 147 (0.7%)
- Irish: 113 (0.6%)
- Polish: 67 (0.3%)
- Guyanese: 32 (0.2%)
- African: 29 (0.1%)
- Russian: 28 (0.1%)
- Arab: 21 (0.1%)
- European: 18 (0.09%)
- West Indian: 15 (0.07%)
- Pennsylvania German: 9 (0.04%)
- Israeli: 8 (0.04%)
- Yugoslavian: 8 (0.04%)
- French: 6 (0.03%)
- Hungarian: 6 (0.03%)
- Liberian: 5 (0.02%)
- Ukrainian: 5 (0.02%)
- Scotch-Irish: 4 (0.02%)
Most common places of birth for foreign-born residents (%):
| Bridgeton: | 73.0% (4,342) |
| New Jersey: | 4.8% (102,527) |
| Bridgeton: | 11.0% (652) |
| New Jersey: | 2.2% (46,813) |
| Bridgeton: | 3.3% (198) |
| New Jersey: | 4.2% (90,817) |
| Bridgeton: | 3.1% (187) |
| New Jersey: | 2.2% (47,365) |
| Bridgeton: | 3.0% (180) |
| New Jersey: | 9.7% (209,055) |
| Bridgeton: | 2.1% (122) |
| New Jersey: | 1.7% (37,335) |
| Bridgeton: | 1.8% (110) |
| New Jersey: | 2.3% (49,491) |
Place of birth for U.S.-born residents:
- This state: 15,842
- Other state: 3,307
- Northeast: 1,544
- Midwest: 188
- South: 990
- West: 520
89.7% of Bridgeton residents lived in the same house 1 years ago.
Out of people who lived in different houses, 29.6% lived in this county.
Out of people who lived in different counties, 61.2% lived in New Jersey.
| Bridgeton: | 89.7% |
| State average: | 90.4% |
Education attainment for males 25 years and older:
- No schooling: 334
- Nursery to 4th grade: 288
- 5th and 6th grade: 511
- 7th and 8th grade: 318
- 9th grade: 249
- 10th grade: 477
- 11th grade: 217
- 12th grade, no diploma: 118
- High school graduate (or equivalency): 4,358
- Less than 1 year of college: 210
- Some college more than 1 year, no degree: 735
- Associate degree: 407
- Bachelor's degree: 231
- Master's degree: 115
- Professional school degree: 37
- Doctorate degree: 3

Education attainment for females 25 years and older:
- No schooling: 341
- Nursery to 4th grade: 277
- 5th and 6th grade: 760
- 7th and 8th grade: 387
- 9th grade: 204
- 10th grade: 236
- 11th grade: 98
- 12th grade, no diploma: 64
- High school graduate (or equivalency): 2,517
- Less than 1 year of college: 362
- Some college more than 1 year, no degree: 456
- Associate degree: 460
- Bachelor's degree: 655
- Master's degree: 115
- Professional school degree: 70
- Doctorate degree: 7


Housing units in structures:
- One, detached: 3,176
- One, attached: 2,023
- Two: 676
- 3 or 4: 423
- 5 to 9: 322
- 10 to 19: 356
- 20 to 49: 97
- 50 or more: 573
- Mobile homes: 5
Housing units lacking complete kitchen facilities in 2022: 3.8%
House/condo owner moved in on average 11 years ago
Renter moved in on average 8 years ago

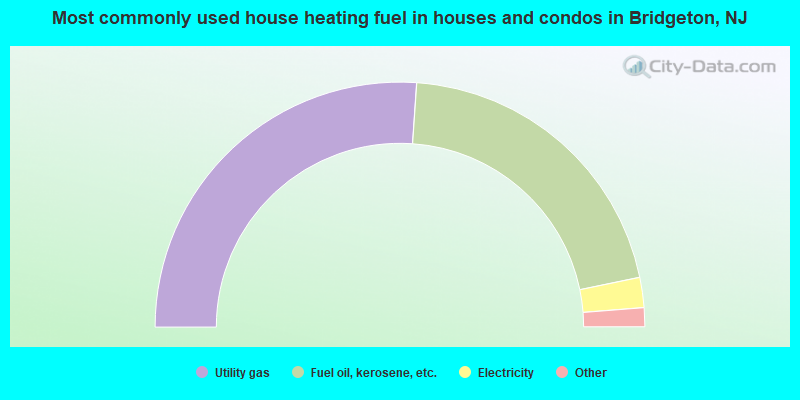
- 52.2%Utility gas
- 41.3%Fuel oil, kerosene, etc.
- 4.0%Electricity
- 1.9%Bottled, tank, or LP gas
- 0.6%Wood
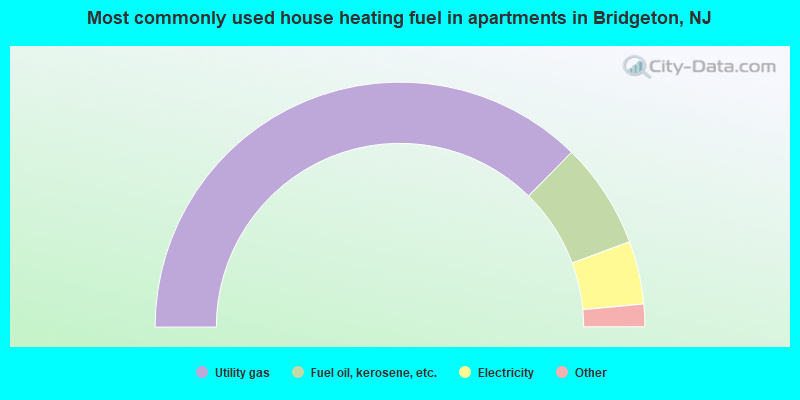
- 74.8%Utility gas
- 14.0%Fuel oil, kerosene, etc.
- 8.3%Electricity
- 2.5%Bottled, tank, or LP gas
- 0.4%No fuel used
Private vs. public school enrollment:
| Here: | 3.4% |
| New Jersey: | 12.3% |
| Here: | 0.0% |
| New Jersey: | 13.1% |
| Here: | 17.2% |
| New Jersey: | 33.2% |


