Brandon, MS (Mississippi) Houses and Residents
| Brandon: | $264,905 |
| Mississippi: | $162,500 |
Total population: 23,156 (Urban population: 14,762, Rural population: 1,572 (all nonfarm))
Houses: 9,666 (9,419 occupied: 7,477 owner occupied, 1,748 renter occupied)
| % of renters here: | 19% |
| State: | 30% |
Housing density: 455 houses/condos per square mile
Median price asked for vacant for-sale houses and condos in 2022: $53,285.
Median contract rent in 2022: $931 (lower quartile is $665, upper quartile is $1,255)
Median rent asked for vacant for-rent units in 2022: $776
Median gross rent in Brandon, MS in 2022: $1,133
Housing units in Brandon with a mortgage: 4,710 (257 second mortgage, 0 home equity loan, 220 both second mortgage and home equity loan)
Houses without a mortgage: 80
Median household income for houses/condos with a mortgage: $95,220
Median household income for apartments without a mortgage: $82,351
Median monthly housing costs: $1,145
Compare current foreclosures in Brandon, MS:
| Photo | Address | Area | Beds / Baths | Price | Details |
|---|---|---|---|---|---|

|
#1
Whippoorwill Rd
Brandon, MS 39047
|
1,870 sq. feet
|
2 baths 4 beds |
show details | |

|
#2
Parkway Rd
Brandon, MS 39047
|
2,095 sq. feet
|
2 baths 4 beds |
show details | |

|
#3
Oakleigh Pl
Brandon, MS 39047
|
1,442 sq. feet
|
1 baths 3 beds |
show details | |

|
#4
Burnham Rd S
Brandon, MS 39042
|
1,225 sq. feet
|
1 baths 6 beds |
show details | |

|
#5
Jasmine Ct
Brandon, MS 39047
|
1,500 sq. feet
|
1 baths 3 beds |
show details | |

|
#6
N Birch Dr
Brandon, MS 39047
|
2,587 sq. feet
|
1 baths 4 beds |
show details | |

|
#7
Magnolia Pl
Brandon, MS 39042
|
1,589 sq. feet
|
1 baths 3 beds |
show details | |

|
#8
Lincolns Dr
Brandon, MS 39042
|
1,578 sq. feet
|
1 baths 3 beds |
show details | |

|
#9
Springridge Dr
Brandon, MS 39042
|
1,350 sq. feet
|
1 baths 3 beds |
show details | |

|
#10
Brenmar St
Brandon, MS 39042
|
1,276 sq. feet
|
1 baths 3 beds |
show details |
| Photo | Address | Area | Beds / Baths | Price | Details |
|---|---|---|---|---|---|

|
#11
G W Bush St
Brandon, MS 39047
|
1,652 sq. feet
|
1 baths 3 beds |
show details | |

|
#12
Commonwealth Ave
Brandon, MS 39047
|
1,271 sq. feet
|
1 baths 3 beds |
show details | |

|
#13
Bradford Dr
Brandon, MS 39047
|
1,438 sq. feet
|
1 baths 3 beds |
show details | |

|
#14
Edgewater Branch Dr
Brandon, MS 39042
|
1,394 sq. feet
|
1 baths 3 beds |
show details | |

|
#15
Dearman Rd
Brandon, MS 39042
|
1,836 sq. feet
|
1 baths 3 beds |
show details | |

|
#16
Briars Bnd
Brandon, MS 39042
|
1,592 sq. feet
|
1 baths 3 beds |
show details | |

|
#17
Fawnwood Dr
Brandon, MS 39042
|
2,417 sq. feet
|
1 baths 4 beds |
show details | |

|
#18
Park Ln
Brandon, MS 39047
|
1,713 sq. feet
|
1 baths 3 beds |
show details | |

|
#19
Trip Dr
Brandon, MS 39042
|
1,459 sq. feet
|
1 baths 3 beds |
show details | |

|
#20
Speers Valley Rd
Brandon, MS 39042
|
2,132 sq. feet
|
1 baths 3 beds |
show details |
| Photo | Address | Area | Beds / Baths | Price | Details |
|---|---|---|---|---|---|

|
#21
Donald Ln
Brandon, MS 39047
|
1,296 sq. feet
|
1 baths 3 beds |
show details | |

|
#22
Corner Of Spillway Rd.
Brandon, MS 39047
|
- sq. feet
|
- baths - beds |
$450,000
|
show details |

|
#23
S College St
Brandon, MS 39042
|
1,326 sq. feet
|
1 baths 3 beds |
show details | |

|
#24
Pine Meadows Ln
Brandon, MS 39042
|
2,065 sq. feet
|
1 baths 3 beds |
show details | |

|
#25
Magnolia Trl
Brandon, MS 39047
|
1,529 sq. feet
|
1 baths 4 beds |
show details | |

|
#26
Woodcliff Pl
Brandon, MS 39042
|
1,709 sq. feet
|
1 baths 3 beds |
show details | |

|
#27
Camelot Way
Brandon, MS 39047
|
1,765 sq. feet
|
1 baths 3 beds |
show details | |

|
#28
Luckney Rd
Brandon, MS 39042
|
1,656 sq. feet
|
1 baths 3 beds |
show details | |

|
#29
Dana St
Brandon, MS 39042
|
1,328 sq. feet
|
1 baths 3 beds |
show details | |

|
#30
Turtle Ln
Brandon, MS 39047
|
2,015 sq. feet
|
1 baths 3 beds |
show details |
| Photo | Address | Area | Beds / Baths | Price | Details |
|---|---|---|---|---|---|

|
#31
Turtle Ln
Brandon, MS 39047
|
2,324 sq. feet
|
1 baths 4 beds |
show details | |

|
#32
Caitlin Cv
Brandon, MS 39047
|
1,661 sq. feet
|
1 baths 3 beds |
show details | |

|
#33
Crossgates Dr
Brandon, MS 39042
|
1,553 sq. feet
|
1 baths 3 beds |
show details | |

|
#34
Mitchell Cv
Brandon, MS 39047
|
1,620 sq. feet
|
1 baths 3 beds |
show details | |

|
#35
Parker Pl
Brandon, MS 39042
|
1,484 sq. feet
|
1 baths 3 beds |
show details | |

|
#36
N Grove Cir
Brandon, MS 39047
|
1,020 sq. feet
|
1 baths 3 beds |
show details | |

|
#37
Frisky Dr
Brandon, MS 39047
|
1,660 sq. feet
|
1 baths 3 beds |
show details | |

|
#38
Mclaurin Cir
Brandon, MS 39047
|
1,164 sq. feet
|
1 baths 3 beds |
show details | |

|
#39
Red Oak Dr
Brandon, MS 39042
|
930 sq. feet
|
1 baths 2 beds |
show details | |

|
#40
Shell Oil Rd
Brandon, MS 39042
|
1,176 sq. feet
|
1 baths 4 beds |
show details |
| Photo | Address | Area | Beds / Baths | Price | Details |
|---|---|---|---|---|---|

|
#41
Timber Ridge Dr
Brandon, MS 39042
|
1,913 sq. feet
|
1 baths 3 beds |
show details | |

|
#42
Kings Rd
Brandon, MS 39042
|
984 sq. feet
|
1 baths 3 beds |
show details | |

|
#43
Arbor Ct
Brandon, MS 39042
|
2,113 sq. feet
|
1 baths 4 beds |
show details | |

|
#44
Peach Tree Ln
Brandon, MS 39047
|
1,694 sq. feet
|
1 baths 3 beds |
show details | |

|
#45
Stonington Dr
Brandon, MS 39047
|
2,024 sq. feet
|
1 baths 4 beds |
show details | |

|
#46
Frisky Dr
Brandon, MS 39047
|
1,638 sq. feet
|
1 baths 3 beds |
show details | |

|
#47
Susannah Dr
Brandon, MS 39047
|
3,791 sq. feet
|
2 baths 3 beds |
show details | |

|
#48
Glen Oaks Dr
Brandon, MS 39047
|
2,730 sq. feet
|
2 baths 4 beds |
show details | |

|
#49
Bellegrove Cir
Brandon, MS 39047
|
1,621 sq. feet
|
1 baths 3 beds |
show details | |

|
Check over 1 million property listings on Foreclosure.com!
|
browse all offers | |||

Latest news about housing in Brandon, MS collected exclusively by city-data.com from local newspapers, TV, and radio stations

 | Looking for rental houses in Flowood/Brandon area (2 replies) |
| Shocked at the extremely low home prices here! (14 replies) |
| Tesla comes to Brandon (3 replies) |
| Jackson Area Apartments/Rentals (2 replies) |
| We need a rental! (4 replies) |
| Apartment hunting for elderly mother (5 replies) |

Median year apartment built: 1986
Household type by relationship:
Households: 25,428- Male householders: 5,131 (905 living alone), Female householders: 4,260 (1,368 living alone)
5,736 spouses (5,714 opposite-sex spouses), 227 unmarried partners, (227 opposite-sex unmarried partners), 7,328 children (6,417 natural, 166 adopted, 744 stepchildren), 989 grandchildren, 115 brothers or sisters, 221 parents, 0 foster children, 175 other relatives, 208 non-relatives
- In group quarters: 1,033
Size of family households: 3,120 2-persons, 1,214 3-persons, 1,347 4-persons, 356 5-persons, 390 6-persons, 91 7-or-more-persons.
Size of nonfamily households: 2,648 1-person, 154 2-persons, 10 3-persons, 8 4-persons, 18 5-persons.
4,218 married couples with children.
984 single-parent households (113 men, 871 women).
96.5% of residents of Brandon speak English at home.
2.5% of residents speak Spanish at home (74% speak English very well, 15% speak English well, 9% speak English not well, 2% don't speak English at all).
0.6% of residents speak other Indo-European language at home (18% speak English very well, 82% speak English well).
0.4% of residents speak other language at home (100% speak English very well).
Foreign born population: 428 (1.7%)
(42.3% of them are naturalized citizens)
| Here: | 6.9 |
| State: | 6.3 |
| Here: | 4.4 |
| State: | 4.8 |

- Bedrooms in owner-occupied houses and condos in Brandon, Mississippi
- 0no bedroom
- 01 bedroom
- 5192 bedrooms
- 4,1143 bedrooms
- 2,6344 bedrooms
- 2115+ bedrooms

- Bedrooms in renter-occupied apartments in Brandon, Mississippi
- 27no bedroom
- 7691 bedroom
- 5732 bedrooms
- 3393 bedrooms
- 414 bedrooms
- 05+ bedrooms

- Cars and other vehicles available in Brandon in owner-occupied houses/condos
- 44no vehicle
- 1,4831 vehicle
- 3,3032 vehicles
- 1,6263 vehicles
- 8274 vehicles
- 1955+ vehicles

- Cars and other vehicles available in Brandon in renter-occupied apartments
- 47no vehicle
- 1,0051 vehicle
- 5692 vehicles
- 603 vehicles
- 684 vehicles
- 05+ vehicles

- Rooms in owner-occupied houses in Brandon, Mississippi
- 01 room
- 02 rooms
- 603 rooms
- 3384 rooms
- 1,0375 rooms
- 1,7216 rooms
- 1,9407 rooms
- 1,2238 rooms
- 1,1589+ rooms

- Rooms in renter-occupied apartments in Brandon, Mississippi
- 271 room
- 182 rooms
- 6213 rooms
- 4624 rooms
- 3055 rooms
- 2236 rooms
- 717 rooms
- 148 rooms
- 99+ rooms


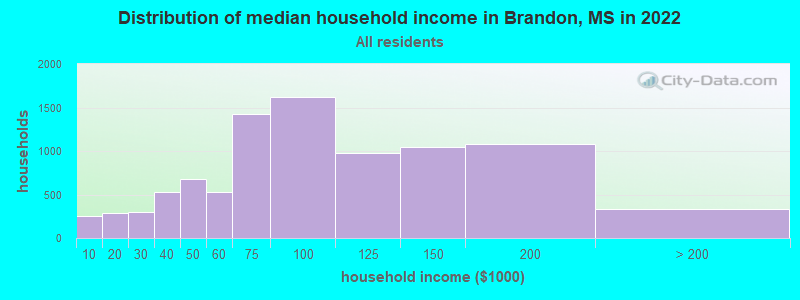
Brandon, MS household income distribution

- 248Less than $10,000
- 286$10,000 to $19,999
- 300$20,000 to $29,999
- 529$30,000 to $39,999
- 683$40,000 to $49,999
- 524$50,000 to $59,999
- 1,423$60,000 to $74,999
- 1,617$75,000 to $99,999
- 978$100,000 to $124,999
- 1,050$125,000 to $149,999
- 1,075$150,000 to $199,999
- 333$200,000 or more
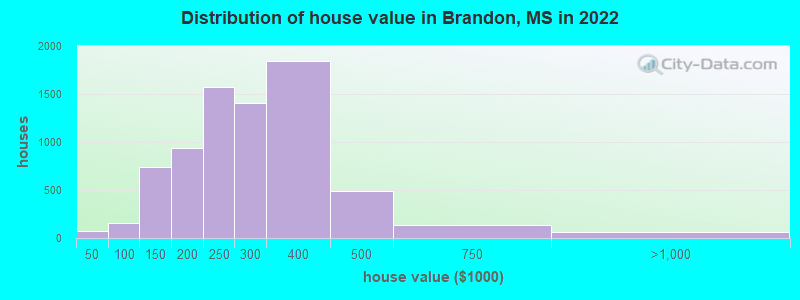
Home value of owner - occupied houses in 2022 in Brandon, MS
-
- 14$10,000 to $14,999
- 26$20,000 to $24,999
- 32$30,000 to $34,999
- 4$50,000 to $59,999
- 2$60,000 to $69,999
- 86$70,000 to $79,999
- 37$80,000 to $89,999
- 27$90,000 to $99,999
- 302$100,000 to $124,999
- 435$125,000 to $149,999
- 412$150,000 to $174,999
- 528$175,000 to $199,999
- 1,572$200,000 to $249,999
- 1,406$250,000 to $299,999
- 1,846$300,000 to $399,999
- 488$400,000 to $499,999
- 139$500,000 to $749,999
- 63$750,000 to $999,999
Rent paid by renters in 2022 in Brandon, MS
-
- 6Less than $100
- 22$100 to $149
- 12$150 to $199
- 12$200 to $249
- 92$250 to $299
- 24$300 to $349
- 23$400 to $449
- 26$450 to $499
- 52$500 to $549
- 42$550 to $599
- 121$600 to $649
- 4$650 to $699
- 15$700 to $749
- 48$750 to $799
- 220$800 to $899
- 186$900 to $999
- 290$1,000 to $1,249
- 390$1,250 to $1,499
- 58$1,500 to $1,999
- 61No cash rent

Percentage of workers working in this county: 56.7%
Number of people working at home: 589 (4.9% of all workers)
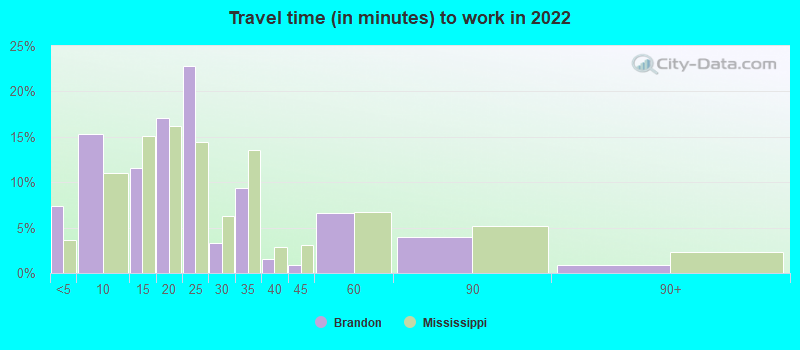
Travel time to work (commute)
- Less than 5 minutes: 155
- 5 to 9 minutes: 1,088
- 10 to 14 minutes: 931
- 15 to 19 minutes: 2,118
- 20 to 24 minutes: 2,658
- 25 to 29 minutes: 629
- 30 to 34 minutes: 2,247
- 35 to 39 minutes: 400
- 40 to 44 minutes: 119
- 45 to 59 minutes: 346
- 60 to 89 minutes: 347
- 90 or more minutes: 262
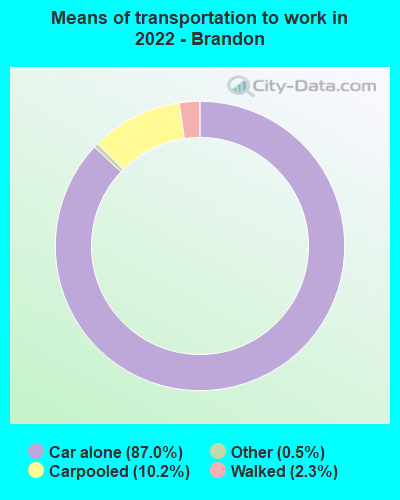
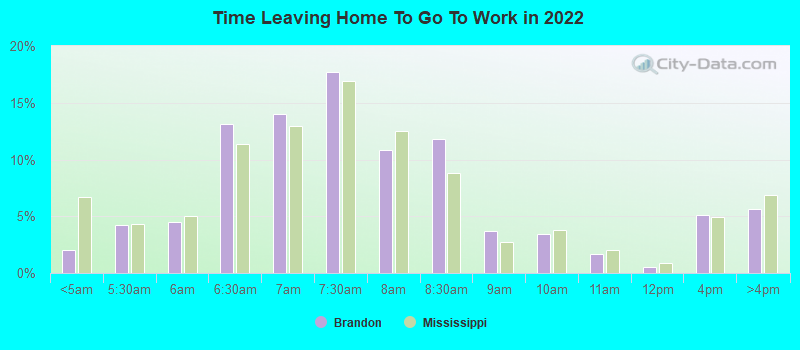
Means of transportation to work:
- Drove a car alone: 7,951 (80.9%)
- Carpooled: 1,039 (10.6%)
- Taxi: 39 (0.4%)
- Walked: 249 (2.5%)
- Worked at home: 589 (6.0%)
- Unemployment by race in 2022
- Unemployment rate for White non-Hispanic residents
- 3.2%Males
- 0.9%Females
- Unemployment rate for Black residents
- 13.3%Males
- 10.4%Females

- Year of entry for the foreign-born population in Brandon, Mississippi
- 332010 or later
- 1782000 to 2009
- 171990 to 1999
- 371980 to 1989
- 261970 to 1979
- 42Before 1970

First ancestries reported:
- American: 2,828 (17.3%)
- English: 2,476 (15.2%)
- Irish: 1,437 (8.8%)
- European: 562 (3.4%)
- German: 447 (2.7%)
- Dutch: 446 (2.7%)
- Scotch-Irish: 358 (2.2%)
- Scottish: 299 (1.8%)
- Italian: 138 (0.8%)
- French: 124 (0.8%)
- Polish: 91 (0.6%)
- Northern European: 85 (0.5%)
- Lebanese: 83 (0.5%)
- Nigerian: 74 (0.5%)
- African: 55 (0.3%)
- Greek: 50 (0.3%)
- Palestinian: 45 (0.3%)
- Welsh: 44 (0.3%)
- Cajun: 24 (0.1%)
- British: 21 (0.1%)
- Brazilian: 19 (0.1%)
- Egyptian: 18 (0.1%)
- Belgian: 12 (0.07%)
- Swedish: 12 (0.07%)
- Iranian: 6 (0.04%)
- Norwegian: 6 (0.04%)
- Ukrainian: 5 (0.03%)
- Croatian: 4 (0.02%)
- Dutch West Indian: 3 (0.02%)
Most common places of birth for foreign-born residents (%):
| Brandon: | 35.0% (161) |
| Mississippi: | 1.3% (870) |
| Brandon: | 14.3% (66) |
| Mississippi: | 1.3% (879) |
| Brandon: | 14.3% (66) |
| Mississippi: | 0.1% (84) |
| Brandon: | 8.9% (41) |
| Mississippi: | 25.4% (17,354) |
| Brandon: | 8.7% (40) |
| Mississippi: | 1.1% (718) |
| Brandon: | 4.3% (20) |
| Mississippi: | 0.8% (556) |
| Brandon: | 3.7% (17) |
| Mississippi: | 0.2% (136) |
| Brandon: | 2.6% (12) |
| Mississippi: | 1.5% (1,043) |
| Brandon: | 2.2% (10) |
| Mississippi: | 0.3% (200) |
| Brandon: | 1.7% (8) |
| Mississippi: | 0.2% (127) |
Place of birth for U.S.-born residents:
- This state: 19,878
- Other state: 4,997
- Northeast: 635
- Midwest: 566
- South: 3,466
- West: 415
86.4% of Brandon residents lived in the same house 1 years ago.
Out of people who lived in different houses, 34.7% lived in this county.
Out of people who lived in different counties, 72.0% lived in Mississippi.
| Brandon: | 86.4% |
| State average: | 88.9% |
Education attainment for males 25 years and older:
- No schooling: 117
- Nursery to 4th grade: 20
- 5th and 6th grade: 0
- 7th and 8th grade: 30
- 9th grade: 70
- 10th grade: 54
- 11th grade: 67
- 12th grade, no diploma: 47
- High school graduate (or equivalency): 1,383
- Less than 1 year of college: 502
- Some college more than 1 year, no degree: 1,498
- Associate degree: 519
- Bachelor's degree: 2,485
- Master's degree: 832
- Professional school degree: 209
- Doctorate degree: 154

Education attainment for females 25 years and older:
- No schooling: 70
- Nursery to 4th grade: 20
- 5th and 6th grade: 32
- 7th and 8th grade: 15
- 9th grade: 9
- 10th grade: 30
- 11th grade: 172
- 12th grade, no diploma: 36
- High school graduate (or equivalency): 1,537
- Less than 1 year of college: 612
- Some college more than 1 year, no degree: 1,402
- Associate degree: 1,034
- Bachelor's degree: 2,666
- Master's degree: 1,243
- Professional school degree: 94
- Doctorate degree: 187


Housing units in structures:
- One, detached: 7,975
- One, attached: 352
- Two: 65
- 3 or 4: 196
- 5 to 9: 250
- 10 to 19: 203
- 20 to 49: 307
- 50 or more: 217
- Mobile homes: 96
Housing units lacking complete kitchen facilities in 2022: 0.3%
House/condo owner moved in on average 12 years ago
Renter moved in on average 3 years ago

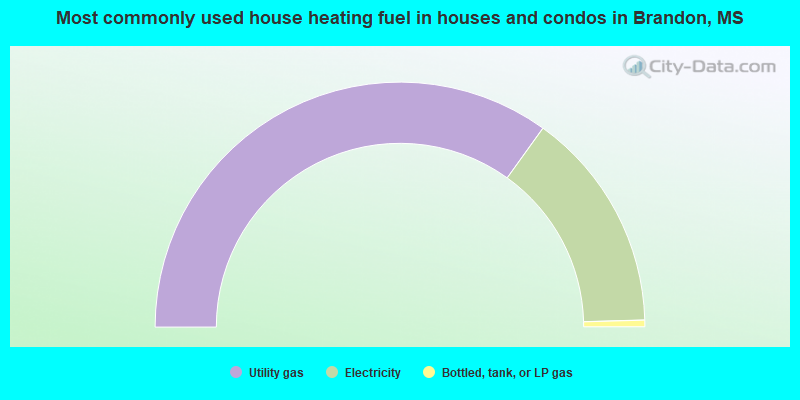
- 69.8%Utility gas
- 29.2%Electricity
- 0.9%Bottled, tank, or LP gas
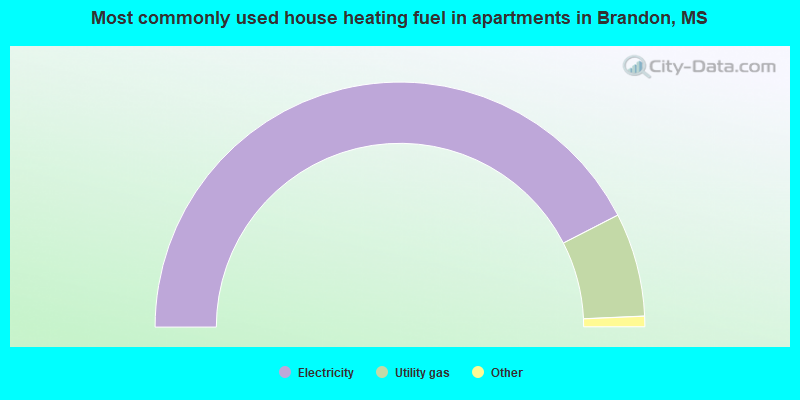
- 85.0%Electricity
- 13.7%Utility gas
- 1.0%No fuel used
- 0.3%Bottled, tank, or LP gas
Private vs. public school enrollment:
| Here: | 16.3% |
| Mississippi: | 16.1% |
| Here: | 13.4% |
| Mississippi: | 14.6% |
| Here: | 27.4% |
| Mississippi: | 12.8% |


