Bound Brook, NJ (New Jersey) Houses and Residents
| Bound Brook: | $350,529 |
| New Jersey: | $428,900 |
Mean price in 2022:
Detached houses: $405,791
Here: $405,791 State: $537,591 Townhouses or other attached units: $288,059
Here: $288,059 State: $381,113 In 2-unit structures: $364,936
Here: $364,936 State: $444,476 In 3-to-4-unit structures: $273,885
Here: $273,885 State: $457,463
Total population: 11,116 (Urban population: 10,191, Rural population: 0)
Houses: 4,829 (4,616 occupied: 2,080 owner occupied, 2,579 renter occupied)
| % of renters here: | 55% |
| State: | 35% |
Housing density: 2,831 houses/condos per square mile
Median price asked for vacant for-sale houses and condos in 2022: $1,550,102.
Median contract rent in 2022: $1,528 (lower quartile is $1,318, upper quartile is $1,942)
Median rent asked for vacant for-rent units in 2022: $2,158
Median gross rent in Bound Brook, NJ in 2022: $1,747
Housing units in Bound Brook with a mortgage: 1,367 (162 second mortgage, 0 home equity loan, 136 both second mortgage and home equity loan)
Houses without a mortgage: 69
Median household income for houses/condos with a mortgage: $131,559
Median household income for apartments without a mortgage: $92,850
Median monthly housing costs: $1,755
Compare current foreclosures near Bound Brook, NJ:
| Photo | Address | Area | Beds / Baths | Price | Details |
|---|---|---|---|---|---|

|
#1
Stratford Pl
Bound Brook, NJ 08805
|
- sq. feet
|
- baths - beds |
show details | |

|
#2
Linden Ave
Bound Brook, NJ 08805
|
- sq. feet
|
- baths - beds |
show details | |

|
#3
Tea St Apt 2301
Bound Brook, NJ 08805
|
- sq. feet
|
- baths - beds |
show details | |

|
#4
132 W High St
Bound Brook, NJ 08805
|
- sq. feet
|
- baths - beds |
show details | |

|
#5
Cherry Ave Apt B3
Bound Brook, NJ 08805
|
- sq. feet
|
- baths - beds |
show details | |

|
#6
Mountain Ave Apt 4
Bound Brook, NJ 08805
|
- sq. feet
|
- baths - beds |
show details | |

|
#7
Heflin St
Bound Brook, NJ 08805
|
- sq. feet
|
- baths - beds |
show details | |

|
#8
William St
Bound Brook, NJ 08805
|
- sq. feet
|
- baths - beds |
show details | |

|
#9
Talmage Ave
Bound Brook, NJ 08805
|
- sq. feet
|
- baths - beds |
show details | |

|
#10
Florence Ave
Colonia, NJ 07067
|
1,930 sq. feet
|
2 baths 3 beds |
$599,900
|
show details |
| Photo | Address | Area | Beds / Baths | Price | Details |
|---|---|---|---|---|---|

|
#11
1st Ave
North Brunswick, NJ 08902
|
1,296 sq. feet
|
2 baths 3 beds |
$349,900
|
show details |

|
#12
Huntington Rd
Union, NJ 07083
|
1,532 sq. feet
|
2 baths 3 beds |
$539,900
|
show details |

|
#13
Catherine St
South Amboy, NJ 08879
|
2,266 sq. feet
|
3 baths 4 beds |
$351,900
|
show details |

|
#14
Sharon Garden Ct
Woodbridge, NJ 07095
|
1,000 sq. feet
|
2 baths 2 beds |
$455,000
|
show details |

|
#15
Hazelhurst St
New Brunswick, NJ 08901
|
465 sq. feet
|
1 baths 1 beds |
$325,000
|
show details |

|
#16
W High St
Bound Brook, NJ 08805
|
- sq. feet
|
- baths - beds |
show details | |

|
#17
John St
Bound Brook, NJ 08805
|
- sq. feet
|
- baths - beds |
show details | |

|
#18
Farm Ln
Bound Brook, NJ 08805
|
- sq. feet
|
- baths - beds |
show details | |

|
#19
Deerhead Dr
Bound Brook, NJ 08805
|
- sq. feet
|
- baths - beds |
show details | |

|
#20
Vosseller Ave
Bound Brook, NJ 08805
|
- sq. feet
|
- baths - beds |
show details |
| Photo | Address | Area | Beds / Baths | Price | Details |
|---|---|---|---|---|---|

|
#21
Marion St
Bound Brook, NJ 08805
|
- sq. feet
|
- baths - beds |
show details | |

|
#22
Longwood Ave
Bound Brook, NJ 08805
|
- sq. feet
|
- baths - beds |
show details | |

|
#23
John St
Bound Brook, NJ 08805
|
- sq. feet
|
- baths - beds |
show details | |

|
#24
Cook Ave
Middlesex, NJ 08846
|
- sq. feet
|
1 baths 3 beds |
$244,900
|
show details |

|
#25
Station Ave
Staten Island, NY 10309
|
- sq. feet
|
1 baths 3 beds |
$649,900
|
show details |

|
#26
N Harrison St
Princeton, NJ 08540
|
2,572 sq. feet
|
2 baths 2 beds |
show details | |

|
#27
Broadway Rd
North Brunswick, NJ 08902
|
2,632 sq. feet
|
4 baths 5 beds |
show details | |

|
#28
Lewis St
Perth Amboy, NJ 08861
|
2,115 sq. feet
|
4 baths 5 beds |
show details | |

|
#29
Stirling Rd
Watchung, NJ 07069
|
1,688 sq. feet
|
2 baths 4 beds |
show details | |

|
#30
Waverly Dr W
Edison, NJ 08817
|
1,947 sq. feet
|
2 baths 4 beds |
show details |
| Photo | Address | Area | Beds / Baths | Price | Details |
|---|---|---|---|---|---|

|
#31
Pershing Ave
Roselle Park, NJ 07204
|
1,885 sq. feet
|
2 baths 4 beds |
show details | |

|
#32
Thorn St
Rahway, NJ 07065
|
1,986 sq. feet
|
1 baths 3 beds |
show details | |

|
#33
Runyon Ave
Middlesex, NJ 08846
|
1,188 sq. feet
|
1 baths 3 beds |
show details | |

|
#34
Starkin Rd
Edison, NJ 08837
|
832 sq. feet
|
1 baths 2 beds |
show details | |

|
#35
So 15th Ave
Manville, NJ 08835
|
816 sq. feet
|
1 baths 3 beds |
show details | |

|
#36
1st St
Dunellen, NJ 08812
|
1,245 sq. feet
|
1 baths 3 beds |
show details | |

|
#37
Desota Ave
Woodbridge, NJ 07095
|
1,150 sq. feet
|
1 baths 3 beds |
show details | |

|
#38
E 5th Ave
Roselle, NJ 07203
|
1,342 sq. feet
|
2 baths 3 beds |
show details | |

|
#39
Normandy Ct
Flemington, NJ 08822
|
800 sq. feet
|
1 baths 1 beds |
show details | |

|
#40
W Clay Ave
Roselle Park, NJ 07204
|
1,974 sq. feet
|
1 baths 3 beds |
show details |
| Photo | Address | Area | Beds / Baths | Price | Details |
|---|---|---|---|---|---|

|
#41
Ironia Rd
Mendham, NJ 07945
|
4,522 sq. feet
|
4 baths 5 beds |
show details | |

|
#42
Carnegie Ave
Plainfield, NJ 07060
|
1,210 sq. feet
|
1 baths 3 beds |
show details | |

|
#43
Athens Ave
South Amboy, NJ 08879
|
1,790 sq. feet
|
2 baths 3 beds |
show details | |

|
#44
South St
Old Bridge, NJ 08857
|
2,198 sq. feet
|
2 baths 4 beds |
show details | |

|
#45
Seymour Ave
Linden, NJ 07036
|
768 sq. feet
|
1 baths 3 beds |
show details | |

|
#46
Spruce St
Roselle, NJ 07203
|
1,334 sq. feet
|
1 baths 3 beds |
show details | |

|
#47
Morning Dew Ct
Old Bridge, NJ 08857
|
1,793 sq. feet
|
2 baths 3 beds |
show details | |

|
#48
Donaldson Pl
Linden, NJ 07036
|
768 sq. feet
|
3 baths 3 beds |
show details | |

|
#49
Irving St
Carteret, NJ 07008
|
1,110 sq. feet
|
1 baths 3 beds |
show details | |

|
Check over 1 million property listings on Foreclosure.com!
|
browse all offers | |||


Median year apartment built: 1964
Household type by relationship:
Households: 11,971- Male householders: 2,342 (683 living alone), Female householders: 2,249 (644 living alone)
1,940 spouses (1,908 opposite-sex spouses), 517 unmarried partners, (499 opposite-sex unmarried partners), 3,551 children (3,139 natural, 113 adopted, 298 stepchildren), 156 grandchildren, 249 brothers or sisters, 125 parents, 0 foster children, 502 other relatives, 285 non-relatives
- In group quarters: 49
Size of family households: 1,119 2-persons, 733 3-persons, 724 4-persons, 403 5-persons, 39 6-persons, 94 7-or-more-persons.
Size of nonfamily households: 1,311 1-person, 221 2-persons, 6 3-persons, 15 5-persons.
1,471 married couples with children.
797 single-parent households (485 men, 312 women).
47.1% of residents of Bound Brook speak English at home.
43.7% of residents speak Spanish at home (49% speak English very well, 22% speak English well, 18% speak English not well, 11% don't speak English at all).
5.1% of residents speak other Indo-European language at home (72% speak English very well, 19% speak English well, 9% speak English not well).
2.8% of residents speak Asian or Pacific Island language at home (58% speak English very well, 24% speak English well, 16% speak English not well, 2% don't speak English at all).
0.5% of residents speak other language at home (100% speak English very well).
Foreign born population: 4,165 (34.8%)
(40.7% of them are naturalized citizens)
| Here: | 6.2 |
| State: | 6.8 |
| Here: | 3.9 |
| State: | 3.9 |

- Bedrooms in owner-occupied houses and condos in Bound Brook, New Jersey
- 20no bedroom
- 341 bedroom
- 5932 bedrooms
- 9663 bedrooms
- 3694 bedrooms
- 985+ bedrooms

- Bedrooms in renter-occupied apartments in Bound Brook, New Jersey
- 109no bedroom
- 8771 bedroom
- 1,0372 bedrooms
- 4173 bedrooms
- 1144 bedrooms
- 265+ bedrooms

- Cars and other vehicles available in Bound Brook in owner-occupied houses/condos
- 28no vehicle
- 6221 vehicle
- 9442 vehicles
- 3473 vehicles
- 1024 vehicles
- 385+ vehicles

- Cars and other vehicles available in Bound Brook in renter-occupied apartments
- 534no vehicle
- 1,3351 vehicle
- 5542 vehicles
- 1413 vehicles
- 164 vehicles
- 05+ vehicles

- Rooms in owner-occupied houses in Bound Brook, New Jersey
- 201 room
- 02 rooms
- 433 rooms
- 2094 rooms
- 3405 rooms
- 5576 rooms
- 4087 rooms
- 1808 rooms
- 3239+ rooms

- Rooms in renter-occupied apartments in Bound Brook, New Jersey
- 951 room
- 2372 rooms
- 5823 rooms
- 7394 rooms
- 4355 rooms
- 3076 rooms
- 1017 rooms
- 558 rooms
- 309+ rooms


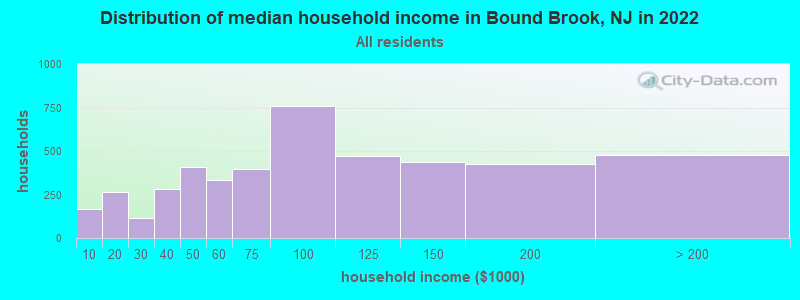
Bound Brook, NJ household income distribution

- 164Less than $10,000
- 264$10,000 to $19,999
- 115$20,000 to $29,999
- 283$30,000 to $39,999
- 406$40,000 to $49,999
- 333$50,000 to $59,999
- 398$60,000 to $74,999
- 759$75,000 to $99,999
- 472$100,000 to $124,999
- 434$125,000 to $149,999
- 425$150,000 to $199,999
- 478$200,000 or more
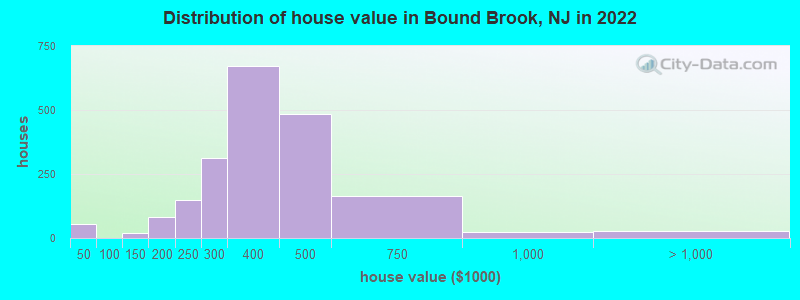
Home value of owner - occupied houses in 2022 in Bound Brook, NJ
-
- 37$25,000 to $29,999
- 17$30,000 to $34,999
- 18$125,000 to $149,999
- 7$150,000 to $174,999
- 74$175,000 to $199,999
- 147$200,000 to $249,999
- 310$250,000 to $299,999
- 673$300,000 to $399,999
- 484$400,000 to $499,999
- 165$500,000 to $749,999
- 24$750,000 to $999,999
- 7$1,000,000 to $1,499,999
- 21$2,000,000 or more
Rent paid by renters in 2022 in Bound Brook, NJ
-
- 20$700 to $749
- 65$800 to $899
- 52$900 to $999
- 302$1,000 to $1,249
- 686$1,250 to $1,499
- 906$1,500 to $1,999
- 283$2,000 to $2,499
- 120$2,500 to $2,999
- 54No cash rent


Percentage of workers working in this county: 73.0%
Number of people working at home: 657 (10.1% of all workers)
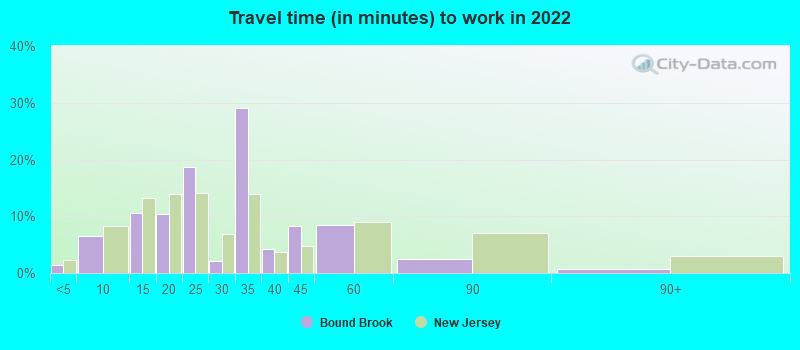
Travel time to work (commute)
- Less than 5 minutes: 70
- 5 to 9 minutes: 533
- 10 to 14 minutes: 997
- 15 to 19 minutes: 1,354
- 20 to 24 minutes: 783
- 25 to 29 minutes: 390
- 30 to 34 minutes: 623
- 35 to 39 minutes: 163
- 40 to 44 minutes: 85
- 45 to 59 minutes: 391
- 60 to 89 minutes: 178
- 90 or more minutes: 55
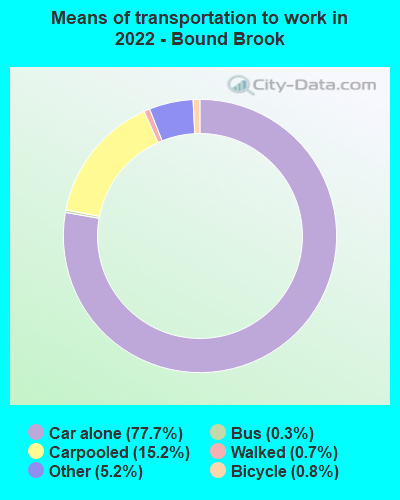
Means of transportation to work:
- Drove a car alone: 1,863 (59.8%)
- Carpooled: 450 (14.4%)
- Bus: 8 (0.3%)
- Taxi: 146 (4.7%)
- Bicycle: 17 (0.5%)
- Walked: 25 (0.8%)
- Worked at home: 657 (21.1%)

- Unemployment by race in 2022
- Unemployment rate for White non-Hispanic residents
- 6.5%Males
- 4.4%Females
- Unemployment rate for Black residents
- 9.8%Males
- Unemployment rate for Asian residents
- 8.4%Males
- Unemployment rate for other race residents
- 6.9%Males
- Unemployment rate for two or more race residents
- 2.3%Males
- 6.3%Females
- Unemployment rate for Hispanic or Latino residents
- 6.0%Males
- 2.6%Females

- Year of entry for the foreign-born population in Bound Brook, New Jersey
- 1,2832010 or later
- 1,3132000 to 2009
- 8201990 to 1999
- 5251980 to 1989
- 1711970 to 1979
- 291Before 1970

First ancestries reported:
- Italian: 357 (5.1%)
- American: 261 (3.8%)
- Polish: 260 (3.7%)
- Portuguese: 117 (1.7%)
- German: 113 (1.6%)
- Irish: 64 (0.9%)
- English: 57 (0.8%)
- Norwegian: 47 (0.7%)
- Czechoslovakian: 40 (0.6%)
- Greek: 39 (0.6%)
- Welsh: 39 (0.6%)
- European: 36 (0.5%)
- Jamaican: 32 (0.5%)
- Yugoslavian: 29 (0.4%)
- Hungarian: 24 (0.3%)
- Dutch: 20 (0.3%)
- Lebanese: 18 (0.3%)
- Turkish: 18 (0.3%)
- Egyptian: 17 (0.2%)
- Iranian: 17 (0.2%)
- Slovak: 15 (0.2%)
- Guyanese: 14 (0.2%)
- Serbian: 13 (0.2%)
- Scotch-Irish: 12 (0.2%)
- African: 12 (0.2%)
- Trinidadian and Tobagonian: 11 (0.2%)
- Eastern European: 10 (0.1%)
- Romanian: 9 (0.1%)
- Brazilian: 8 (0.1%)
- British: 8 (0.1%)
- Ukrainian: 7 (0.1%)
- French Canadian: 3 (0.04%)
- New Zealander: 2 (0.03%)
Most common places of birth for foreign-born residents (%):
| Bound Brook: | 21.2% (900) |
| New Jersey: | 0.7% (14,848) |
| Bound Brook: | 15.1% (639) |
| New Jersey: | 2.2% (46,813) |
| Bound Brook: | 14.6% (619) |
| New Jersey: | 4.8% (102,527) |
| Bound Brook: | 11.2% (474) |
| New Jersey: | 4.2% (90,817) |
| Bound Brook: | 6.3% (266) |
| New Jersey: | 2.7% (58,563) |
| Bound Brook: | 3.2% (134) |
| New Jersey: | 2.3% (48,885) |
| Bound Brook: | 3.0% (126) |
| New Jersey: | 4.4% (95,275) |
| Bound Brook: | 2.5% (107) |
| New Jersey: | 12.8% (274,609) |
| Bound Brook: | 2.0% (85) |
| New Jersey: | 2.3% (48,811) |
| Bound Brook: | 1.9% (81) |
| New Jersey: | 1.7% (37,335) |
| Bound Brook: | 1.8% (78) |
| New Jersey: | 4.0% (85,934) |
| Bound Brook: | 1.7% (72) |
| New Jersey: | 9.7% (209,055) |
| Bound Brook: | 1.6% (66) |
| New Jersey: | 3.3% (70,512) |
| Bound Brook: | 1.5% (64) |
| New Jersey: | 3.7% (78,969) |
| Bound Brook: | 1.5% (64) |
| New Jersey: | 1.3% (28,871) |
Place of birth for U.S.-born residents:
- This state: 5,994
- Other state: 1,689
- Northeast: 972
- Midwest: 154
- South: 381
- West: 150
85.0% of Bound Brook residents lived in the same house 1 years ago.
Out of people who lived in different houses, 36.0% lived in this county.
Out of people who lived in different counties, 48.5% lived in New Jersey.
| Bound Brook: | 85.0% |
| State average: | 90.4% |
Education attainment for males 25 years and older:
- No schooling: 74
- Nursery to 4th grade: 13
- 5th and 6th grade: 53
- 7th and 8th grade: 94
- 9th grade: 98
- 10th grade: 0
- 11th grade: 11
- 12th grade, no diploma: 192
- High school graduate (or equivalency): 1,319
- Less than 1 year of college: 266
- Some college more than 1 year, no degree: 676
- Associate degree: 183
- Bachelor's degree: 729
- Master's degree: 306
- Professional school degree: 113
- Doctorate degree: 103

Education attainment for females 25 years and older:
- No schooling: 42
- Nursery to 4th grade: 24
- 5th and 6th grade: 31
- 7th and 8th grade: 121
- 9th grade: 16
- 10th grade: 8
- 11th grade: 141
- 12th grade, no diploma: 151
- High school graduate (or equivalency): 1,061
- Less than 1 year of college: 259
- Some college more than 1 year, no degree: 494
- Associate degree: 382
- Bachelor's degree: 790
- Master's degree: 434
- Professional school degree: 70
- Doctorate degree: 110


Housing units in structures:
- One, detached: 2,121
- One, attached: 367
- Two: 620
- 3 or 4: 585
- 5 to 9: 191
- 10 to 19: 177
- 20 to 49: 176
- 50 or more: 587
Housing units lacking complete kitchen facilities in 2022: 0.7%
House/condo owner moved in on average 15 years ago
Renter moved in on average 3 years ago

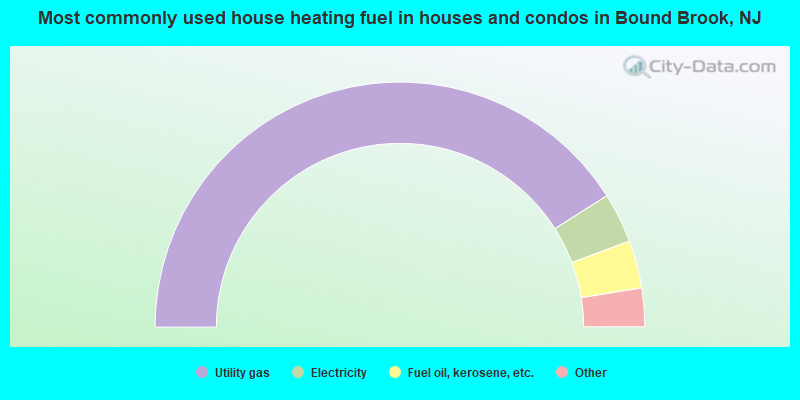
- 82.1%Utility gas
- 6.6%Electricity
- 6.3%Fuel oil, kerosene, etc.
- 2.6%No fuel used
- 0.8%Bottled, tank, or LP gas
- 0.7%Other fuel
- 0.5%Coal or coke
- 0.3%Solar energy
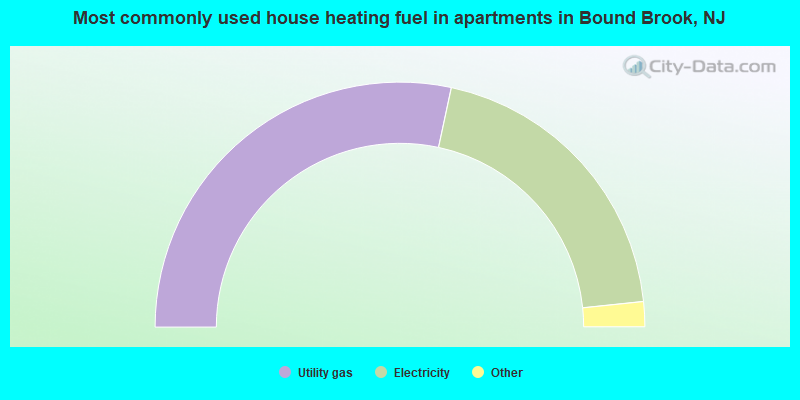
- 56.8%Utility gas
- 40.0%Electricity
- 1.8%No fuel used
- 1.2%Fuel oil, kerosene, etc.
- 0.2%Other fuel
Private vs. public school enrollment:
| Here: | 3.5% |
| New Jersey: | 12.3% |
| Here: | 7.8% |
| New Jersey: | 13.1% |
| Here: | 10.3% |
| New Jersey: | 33.2% |


