Bothell, WA (Washington) Houses and Residents
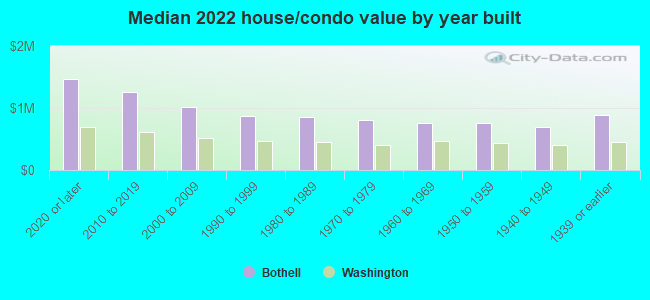
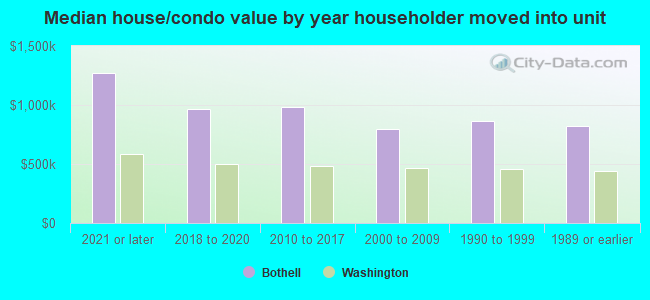
| Bothell: | $902,281 |
| Washington: | $569,500 |
Total population: 36,567 (Urban population: 29,869, Rural population: 0)
Houses: 20,181 (19,031 occupied: 12,161 owner occupied, 6,844 renter occupied)
| % of renters here: | 36% |
| State: | 36% |
Housing density: 1,674 houses/condos per square mile
Median price asked for vacant for-sale houses and condos in 2022: $236,576.
Median contract rent in 2022: $1,954 (lower quartile is $1,627, upper quartile is over $2,000)
Median rent asked for vacant for-rent units in 2022: $2,622
Median gross rent in Bothell, WA in 2022: over $2,000
Housing units in Bothell with a mortgage: 8,617 (1,066 second mortgage, 5 home equity loan, 1,006 both second mortgage and home equity loan)
Houses without a mortgage: 205
Median household income for houses/condos with a mortgage: $185,600
Median household income for apartments without a mortgage: $98,149
Median monthly housing costs: $2,258
Compare current foreclosures in Bothell, WA:
| Photo | Address | Area | Beds / Baths | Price | Details |
|---|---|---|---|---|---|

|
#1
3rd Dr SE
Bothell, WA 98012
|
1,957 sq. feet
|
2 baths 4 beds |
show details | |

|
#2
20th Ave SE
Bothell, WA 98021
|
1,552 sq. feet
|
2 baths 3 beds |
show details | |

|
#3
224th St SE
Bothell, WA 98021
|
1,717 sq. feet
|
2 baths 3 beds |
show details | |

|
#4
19th Dr SE
Bothell, WA 98012
|
852 sq. feet
|
1 baths 3 beds |
show details | |

|
#5
199th St SW
Bothell, WA 98012
|
2,846 sq. feet
|
2 baths 4 beds |
show details | |

|
#6
49th Ave SE
Bothell, WA 98012
|
1,756 sq. feet
|
2 baths 3 beds |
show details | |

|
#7
Cascadian Way
Bothell, WA 98012
|
1,492 sq. feet
|
2 baths 3 beds |
show details | |

|
#8
23rd Ave SE
Bothell, WA 98021
|
1,640 sq. feet
|
2 baths 4 beds |
show details | |

|
#9
85th Pl NE
Bothell, WA 98011
|
1,810 sq. feet
|
2 baths 3 beds |
show details | |

|
#10
102nd Ave NE
Bothell, WA 98011
|
3,040 sq. feet
|
2 baths 3 beds |
show details |
| Photo | Address | Area | Beds / Baths | Price | Details |
|---|---|---|---|---|---|

|
#11
27th Dr SE # 43
Bothell, WA 98012
|
2,064 sq. feet
|
2 baths 4 beds |
show details | |

|
#12
29th Dr SE
Bothell, WA 98012
|
1,789 sq. feet
|
2 baths 3 beds |
show details | |

|
#13
35th Ave SE Apt 5a
Bothell, WA 98012
|
1,562 sq. feet
|
2 baths 3 beds |
show details | |

|
#14
31st Dr SE
Bothell, WA 98012
|
1,248 sq. feet
|
1 baths 3 beds |
show details | |

|
#15
25th Ave SE
Bothell, WA 98012
|
1,372 sq. feet
|
2 baths 3 beds |
show details | |

|
#16
Cascadian Way
Bothell, WA 98012
|
1,487 sq. feet
|
1 baths 3 beds |
show details | |

|
#17
Eason Ave
Bothell, WA 98011
|
760 sq. feet
|
1 baths 2 beds |
show details | |

|
#18
139th Pl SE
Bothell, WA 98012
|
1,336 sq. feet
|
1 baths 3 beds |
show details | |

|
#19
204th St SE
Bothell, WA 98012
|
1,650 sq. feet
|
1 baths 3 beds |
show details | |

|
#20
183rd St Se, Ofc 4307
Bothell, WA 98012
|
1,920 sq. feet
|
1 baths 2 beds |
show details |
| Photo | Address | Area | Beds / Baths | Price | Details |
|---|---|---|---|---|---|

|
#21
NE 150th St
Bothell, WA 98011
|
1,290 sq. feet
|
1 baths 3 beds |
show details | |

|
#22
196th Pl SW
Bothell, WA 98012
|
2,140 sq. feet
|
2 baths 4 beds |
show details | |

|
#23
NE 155th St
Bothell, WA 98011
|
2,500 sq. feet
|
2 baths 4 beds |
show details | |

|
#24
171st Pl SE
Bothell, WA 98012
|
2,490 sq. feet
|
2 baths 3 beds |
show details | |

|
#25
North Rd
Bothell, WA 98012
|
1,232 sq. feet
|
2 baths 3 beds |
show details | |

|
#26
Lake Dr W
Bothell, WA 98021
|
1,344 sq. feet
|
2 baths 3 beds |
show details | |

|
#27
175th St SE
Bothell, WA 98012
|
3,202 sq. feet
|
3 baths 3 beds |
show details | |

|
#28
204th Pl SE
Bothell, WA 98012
|
1,802 sq. feet
|
2 baths 4 beds |
show details | |

|
#29
Baldwin Rd
Bothell, WA 98012
|
1,572 sq. feet
|
2 baths 4 beds |
show details | |

|
#30
216th St SW
Bothell, WA 98021
|
1,644 sq. feet
|
2 baths 3 beds |
show details |
| Photo | Address | Area | Beds / Baths | Price | Details |
|---|---|---|---|---|---|

|
#31
25th Ave SE
Bothell, WA 98012
|
1,372 sq. feet
|
2 baths 3 beds |
show details | |

|
#32
Juanita Woodinville Way NE Unit 411
Bothell, WA 98011
|
1,147 sq. feet
|
2 baths 3 beds |
show details | |

|
#33
31st Dr SE
Bothell, WA 98012
|
1,056 sq. feet
|
2 baths 3 beds |
show details | |

|
#34
Atlas Rd
Bothell, WA 98021
|
2,016 sq. feet
|
2 baths 3 beds |
show details | |

|
#35
140th Pl SE
Bothell, WA 98012
|
2,664 sq. feet
|
2 baths 4 beds |
show details | |

|
#36
214th St SW
Bothell, WA 98021
|
2,052 sq. feet
|
3 baths 3 beds |
show details | |

|
#37
36th Dr SE
Bothell, WA 98012
|
2,678 sq. feet
|
4 baths 4 beds |
show details | |

|
#38
NE 151st St
Bothell, WA 98011
|
2,200 sq. feet
|
3 baths 4 beds |
show details | |

|
#39
NE 162nd St
Bothell, WA 98011
|
3,160 sq. feet
|
2 baths 3 beds |
show details | |

|
#40
20th Dr SE
Bothell, WA 98012
|
1,650 sq. feet
|
2 baths 3 beds |
show details |
| Photo | Address | Area | Beds / Baths | Price | Details |
|---|---|---|---|---|---|

|
#41
158th Pl SE
Bothell, WA 98012
|
3,279 sq. feet
|
2 baths 4 beds |
show details | |

|
#42
164th Pl SE
Bothell, WA 98012
|
1,584 sq. feet
|
2 baths 3 beds |
show details | |

|
#43
Filbert Dr
Bothell, WA 98012
|
3,610 sq. feet
|
3 baths 4 beds |
show details | |

|
#44
Dumas Rd Apt J104
Bothell, WA 98012
|
- sq. feet
|
- baths - beds |
show details | |

|
#45
Bothell Everett Hwy Apt 721
Bothell, WA 98012
|
- sq. feet
|
- baths - beds |
show details | |

|
#46
112th Ave NE Apt 303
Bothell, WA 98011
|
- sq. feet
|
- baths - beds |
show details | |

|
#47
126th Ave NE # 621
Bothell, WA 98011
|
- sq. feet
|
- baths - beds |
show details | |

|
#48
184th Pl SW
Bothell, WA 98012
|
- sq. feet
|
- baths - beds |
show details | |

|
#49
42nd Ave SE
Bothell, WA 98021
|
- sq. feet
|
- baths - beds |
show details | |

|
Check over 1 million property listings on Foreclosure.com!
|
browse all offers | |||

Latest news about housing in Bothell, WA collected exclusively by city-data.com from local newspapers, TV, and radio stations


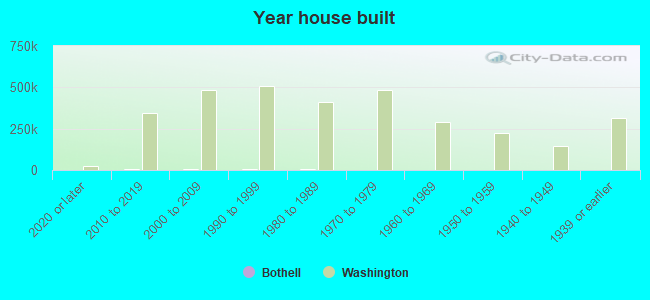
Median year apartment built: 1998
Household type by relationship:
Households: 48,180- Male householders: 10,508 (1,889 living alone), Female householders: 8,019 (2,594 living alone)
10,844 spouses (10,629 opposite-sex spouses), 1,131 unmarried partners, (1,009 opposite-sex unmarried partners), 13,488 children (12,635 natural, 266 adopted, 587 stepchildren), 344 grandchildren, 304 brothers or sisters, 736 parents, 9 foster children, 588 other relatives, 1,541 non-relatives
- In group quarters: 663
Size of family households: 4,948 2-persons, 3,037 3-persons, 3,150 4-persons, 898 5-persons, 318 6-persons, 109 7-or-more-persons.
Size of nonfamily households: 4,821 1-person, 1,326 2-persons, 108 3-persons, 91 4-persons.
8,983 married couples with children.
1,574 single-parent households (507 men, 1,067 women).
70.0% of residents of Bothell speak English at home.
8.1% of residents speak Spanish at home (65% speak English very well, 24% speak English well, 9% speak English not well, 3% don't speak English at all).
9.5% of residents speak other Indo-European language at home (75% speak English very well, 16% speak English well, 8% speak English not well, 1% don't speak English at all).
10.6% of residents speak Asian or Pacific Island language at home (61% speak English very well, 23% speak English well, 14% speak English not well, 2% don't speak English at all).
1.8% of residents speak other language at home (84% speak English very well, 13% speak English well, 3% speak English not well).
Foreign born population: 11,068 (23.0%)
(45.8% of them are naturalized citizens)
| Here: | 6.7 |
| State: | 6.5 |
| Here: | 4.0 |
| State: | 3.9 |
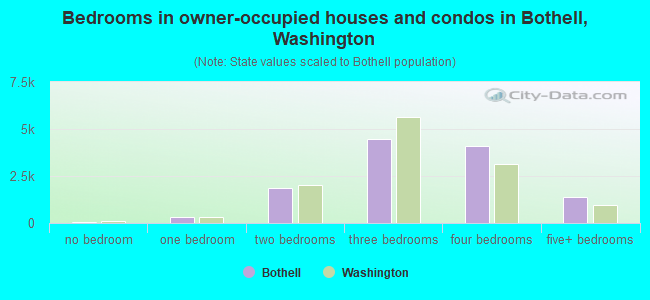
- Bedrooms in owner-occupied houses and condos in Bothell, Washington
- 40no bedroom
- 3111 bedroom
- 1,8682 bedrooms
- 4,4823 bedrooms
- 4,0784 bedrooms
- 1,3815+ bedrooms
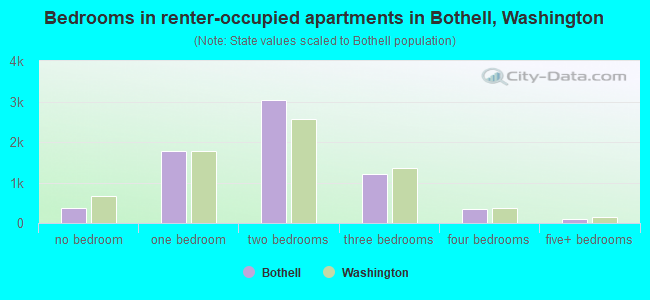
- Bedrooms in renter-occupied apartments in Bothell, Washington
- 382no bedroom
- 1,7741 bedroom
- 3,0302 bedrooms
- 1,2063 bedrooms
- 3504 bedrooms
- 1035+ bedrooms
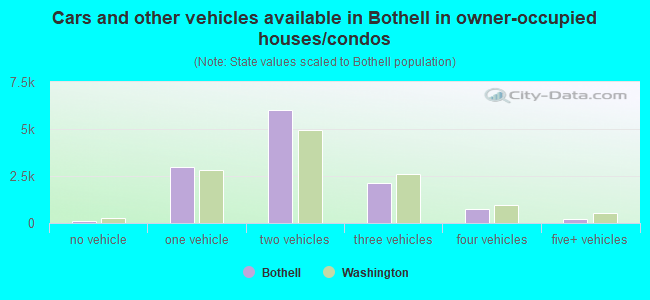
- Cars and other vehicles available in Bothell in owner-occupied houses/condos
- 106no vehicle
- 2,9571 vehicle
- 6,0362 vehicles
- 2,1163 vehicles
- 7414 vehicles
- 2055+ vehicles
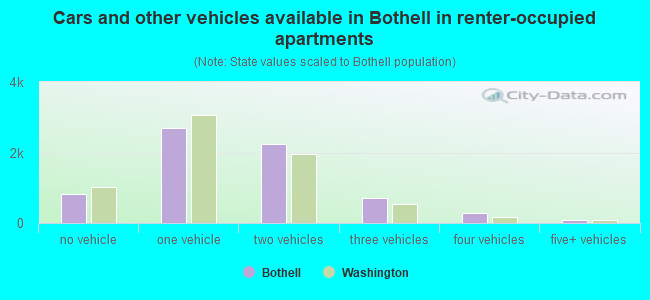
- Cars and other vehicles available in Bothell in renter-occupied apartments
- 829no vehicle
- 2,6971 vehicle
- 2,2352 vehicles
- 7073 vehicles
- 2844 vehicles
- 935+ vehicles
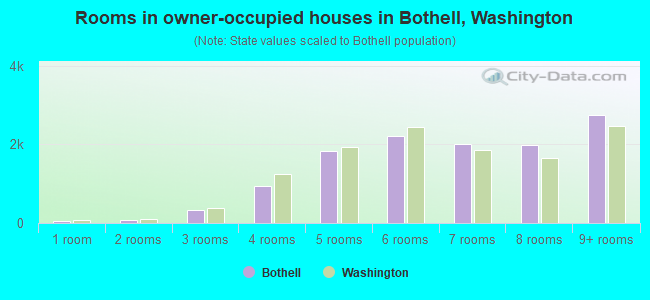
- Rooms in owner-occupied houses in Bothell, Washington
- 401 room
- 642 rooms
- 3313 rooms
- 9424 rooms
- 1,8225 rooms
- 2,2096 rooms
- 2,0057 rooms
- 1,9978 rooms
- 2,7519+ rooms
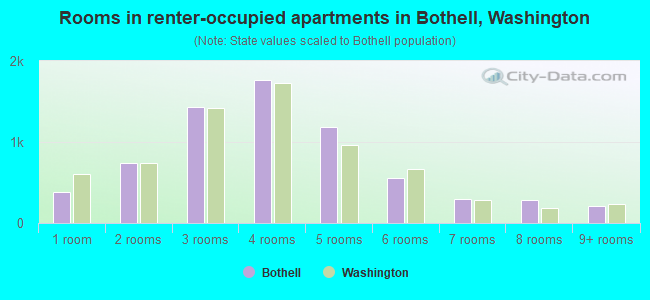
- Rooms in renter-occupied apartments in Bothell, Washington
- 3821 room
- 7432 rooms
- 1,4283 rooms
- 1,7634 rooms
- 1,1895 rooms
- 5586 rooms
- 2927 rooms
- 2808 rooms
- 2109+ rooms
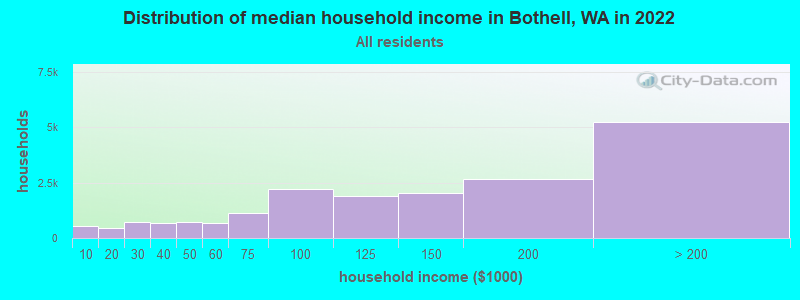
Bothell, WA household income distribution

- 524Less than $10,000
- 466$10,000 to $19,999
- 736$20,000 to $29,999
- 657$30,000 to $39,999
- 706$40,000 to $49,999
- 671$50,000 to $59,999
- 1,140$60,000 to $74,999
- 2,230$75,000 to $99,999
- 1,886$100,000 to $124,999
- 2,019$125,000 to $149,999
- 2,647$150,000 to $199,999
- 5,235$200,000 or more
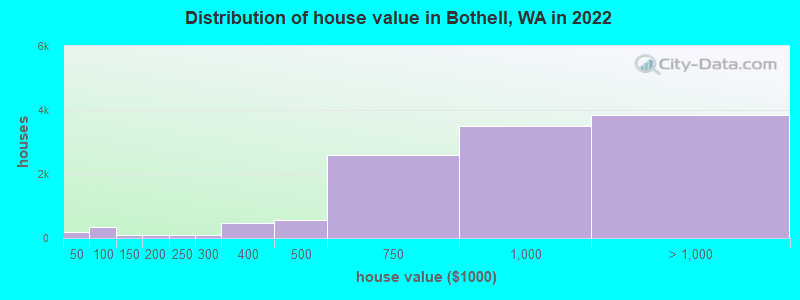
Home value of owner - occupied houses in 2022 in Bothell, WA
-
- 44Less than $10,000
- 27$10,000 to $14,999
- 27$15,000 to $19,999
- 34$20,000 to $24,999
- 22$30,000 to $34,999
- 34$40,000 to $49,999
- 30$50,000 to $59,999
- 57$60,000 to $69,999
- 164$80,000 to $89,999
- 48$90,000 to $99,999
- 25$100,000 to $124,999
- 55$125,000 to $149,999
- 83$150,000 to $174,999
- 13$175,000 to $199,999
- 107$200,000 to $249,999
- 106$250,000 to $299,999
- 465$300,000 to $399,999
- 555$400,000 to $499,999
- 2,599$500,000 to $749,999
- 3,510$750,000 to $999,999
- 2,350$1,000,000 to $1,499,999
- 1,155$1,500,000 to $1,999,999
- 342$2,000,000 or more
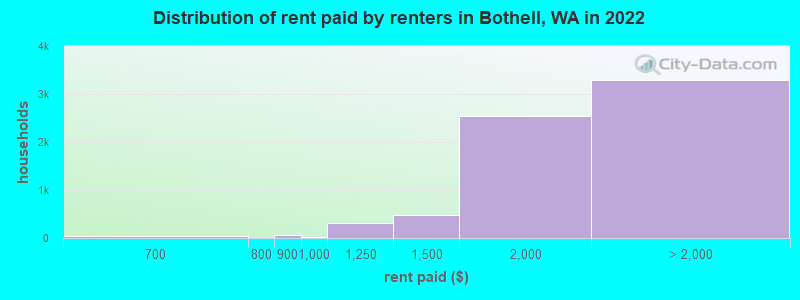
Rent paid by renters in 2022 in Bothell, WA
-
- 22$150 to $199
- 21$250 to $299
- 13$300 to $349
- 13$350 to $399
- 22$600 to $649
- 17$650 to $699
- 58$800 to $899
- 14$900 to $999
- 318$1,000 to $1,249
- 470$1,250 to $1,499
- 2,552$1,500 to $1,999
- 1,680$2,000 to $2,499
- 686$2,500 to $2,999
- 377$3,000 to $3,499
- 399$3,500 or more
- 143No cash rent
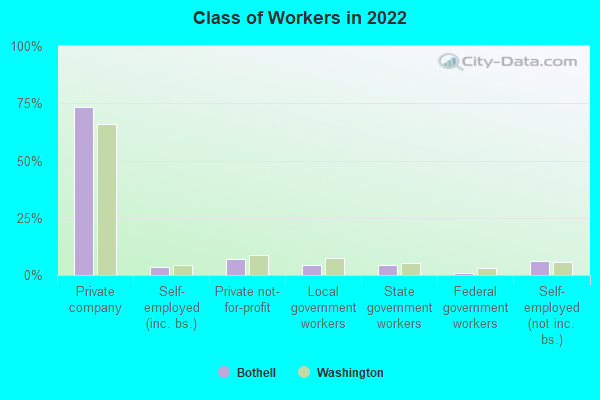
Percentage of workers working in this county: 72.5%
Number of people working at home: 9,149 (35.5% of all workers)
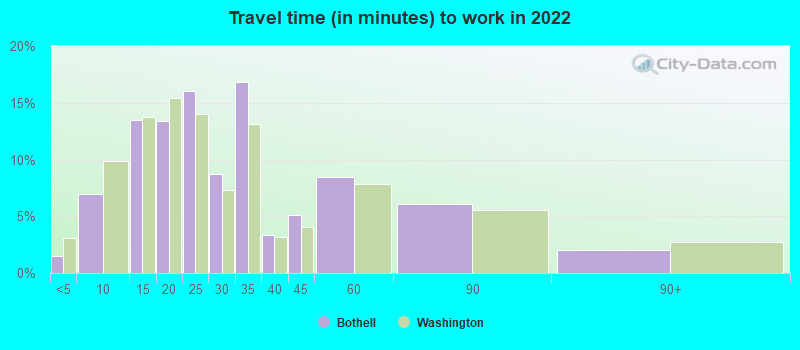
Travel time to work (commute)
- Less than 5 minutes: 384
- 5 to 9 minutes: 1,078
- 10 to 14 minutes: 1,859
- 15 to 19 minutes: 2,151
- 20 to 24 minutes: 2,327
- 25 to 29 minutes: 1,671
- 30 to 34 minutes: 3,082
- 35 to 39 minutes: 572
- 40 to 44 minutes: 931
- 45 to 59 minutes: 1,383
- 60 to 89 minutes: 1,246
- 90 or more minutes: 315
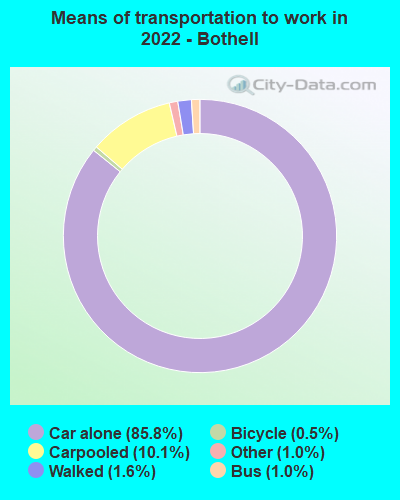
Means of transportation to work:
- Drove a car alone: 21,971 (65.8%)
- Carpooled: 2,476 (7.4%)
- Bus: 160 (0.5%)
- Ferryboat: 10 (0.0%)
- Taxi: 220 (0.7%)
- Bicycle: 127 (0.4%)
- Walked: 360 (1.1%)
- Worked at home: 9,149 (27.4%)
- Unemployment by race in 2022
- Unemployment rate for White non-Hispanic residents
- 3.0%Males
- 3.9%Females
- Unemployment rate for Black residents
- 13.2%Males
- 0.6%Females
- Unemployment rate for Asian residents
- 1.9%Males
- 2.8%Females
- Unemployment rate for other race residents
- 14.8%Females
- Unemployment rate for two or more race residents
- 1.0%Males
- 0.8%Females
- Unemployment rate for Hispanic or Latino residents
- 1.3%Males
- 7.6%Females
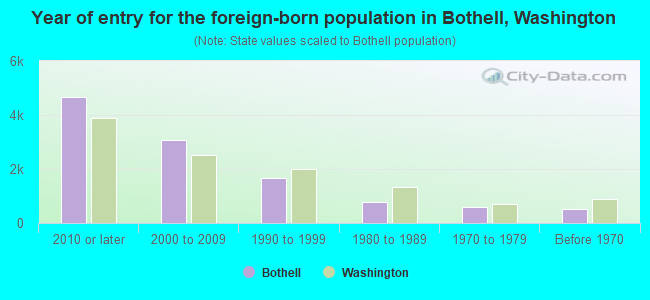
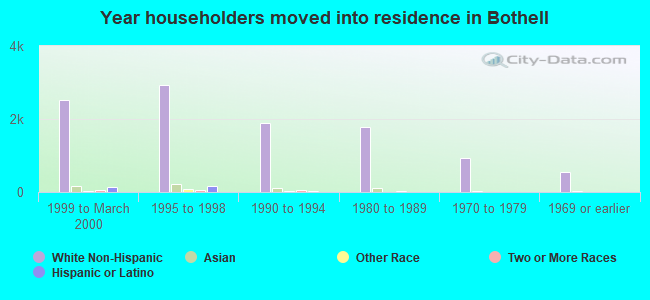
- Year of entry for the foreign-born population in Bothell, Washington
- 4,6852010 or later
- 3,0902000 to 2009
- 1,6741990 to 1999
- 7721980 to 1989
- 5841970 to 1979
- 520Before 1970
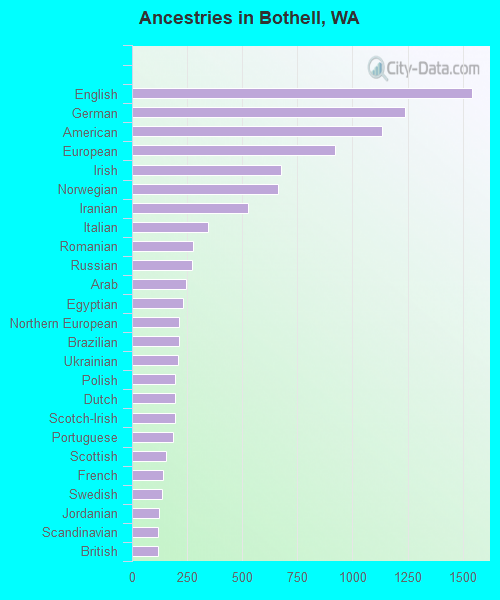
First ancestries reported:
- English: 1,542 (6.8%)
- German: 1,238 (5.4%)
- American: 1,133 (5.0%)
- European: 920 (4.0%)
- Irish: 677 (3.0%)
- Norwegian: 663 (2.9%)
- Iranian: 527 (2.3%)
- Italian: 344 (1.5%)
- Romanian: 276 (1.2%)
- Russian: 274 (1.2%)
- Arab: 246 (1.1%)
- Egyptian: 233 (1.0%)
- Northern European: 214 (0.9%)
- Brazilian: 211 (0.9%)
- Ukrainian: 207 (0.9%)
- Polish: 195 (0.9%)
- Dutch: 193 (0.8%)
- Scotch-Irish: 193 (0.8%)
- Portuguese: 187 (0.8%)
- Scottish: 153 (0.7%)
- French: 140 (0.6%)
- Swedish: 138 (0.6%)
- Jordanian: 123 (0.5%)
- Scandinavian: 120 (0.5%)
- British: 119 (0.5%)
- Canadian: 108 (0.5%)
- Iraqi: 107 (0.5%)
- Israeli: 63 (0.3%)
- Turkish: 60 (0.3%)
- Eastern European: 59 (0.3%)
- Kenyan: 55 (0.2%)
- Swiss: 54 (0.2%)
- Danish: 53 (0.2%)
- French Canadian: 52 (0.2%)
- Armenian: 49 (0.2%)
- Welsh: 44 (0.2%)
- Greek: 36 (0.2%)
- Czech: 26 (0.1%)
- Belgian: 23 (0.1%)
- Lebanese: 21 (0.09%)
- Finnish: 21 (0.09%)
- African: 14 (0.06%)
- Albanian: 11 (0.05%)
- Somali: 11 (0.05%)
- Lithuanian: 6 (0.03%)
- Croatian: 5 (0.02%)
- Pennsylvania German: 4 (0.02%)
- Ethiopian: 2 (0.01%)
Most common places of birth for foreign-born residents (%):
| Bothell: | 20.4% (2,256) |
| Washington: | 8.9% (101,353) |
| Bothell: | 13.9% (1,534) |
| Washington: | 7.4% (84,470) |
| Bothell: | 11.0% (1,215) |
| Washington: | 21.1% (241,655) |
| Bothell: | 5.0% (557) |
| Washington: | 0.8% (9,359) |
| Bothell: | 3.8% (426) |
| Washington: | 0.9% (10,499) |
| Bothell: | 3.7% (413) |
| Washington: | 5.4% (62,003) |
| Bothell: | 3.4% (376) |
| Washington: | 1.9% (21,540) |
| Bothell: | 3.0% (331) |
| Washington: | 6.3% (71,661) |
| Bothell: | 2.8% (307) |
| Washington: | 4.3% (48,886) |
| Bothell: | 2.1% (235) |
| Washington: | 3.1% (35,872) |
| Bothell: | 2.1% (230) |
| Washington: | 0.3% (3,083) |
| Bothell: | 2.0% (226) |
| Washington: | 0.7% (7,568) |
| Bothell: | 2.0% (225) |
| Washington: | 0.1% (1,536) |
| Bothell: | 1.7% (189) |
| Washington: | 1.5% (16,607) |
| Bothell: | 1.6% (180) |
| Washington: | 1.5% (17,453) |
| Bothell: | 1.6% (175) |
| Washington: | 4.1% (47,238) |
Place of birth for U.S.-born residents:
- This state: 21,435
- Other state: 14,594
- Northeast: 1,852
- Midwest: 3,637
- South: 2,218
- West: 6,898
84.8% of Bothell residents lived in the same house 1 years ago.
Out of people who lived in different houses, 33.7% lived in this county.
Out of people who lived in different counties, 63.1% lived in Washington.
| Bothell: | 84.8% |
| State average: | 85.2% |
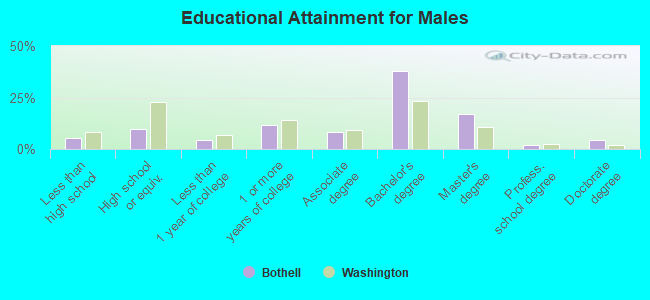
Education attainment for males 25 years and older:
- No schooling: 228
- Nursery to 4th grade: 0
- 5th and 6th grade: 145
- 7th and 8th grade: 37
- 9th grade: 115
- 10th grade: 25
- 11th grade: 96
- 12th grade, no diploma: 232
- High school graduate (or equivalency): 1,670
- Less than 1 year of college: 780
- Some college more than 1 year, no degree: 1,964
- Associate degree: 1,388
- Bachelor's degree: 6,456
- Master's degree: 2,860
- Professional school degree: 307
- Doctorate degree: 721
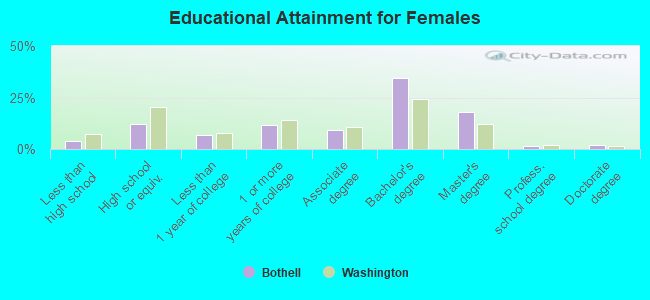
Education attainment for females 25 years and older:
- No schooling: 105
- Nursery to 4th grade: 15
- 5th and 6th grade: 121
- 7th and 8th grade: 88
- 9th grade: 172
- 10th grade: 20
- 11th grade: 30
- 12th grade, no diploma: 147
- High school graduate (or equivalency): 2,078
- Less than 1 year of college: 1,176
- Some college more than 1 year, no degree: 1,994
- Associate degree: 1,559
- Bachelor's degree: 5,829
- Master's degree: 3,051
- Professional school degree: 246
- Doctorate degree: 357


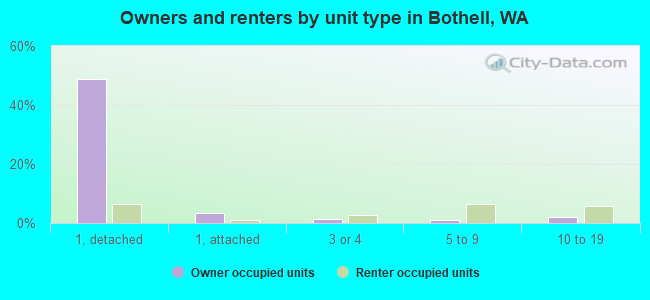
Housing units in structures:
- One, detached: 11,056
- One, attached: 776
- Two: 288
- 3 or 4: 852
- 5 to 9: 1,511
- 10 to 19: 1,603
- 20 to 49: 638
- 50 or more: 2,221
- Mobile homes: 1,130
- Boats, RVs, vans, etc.: 102
Median worth of mobile homes: $228,400
Housing units lacking complete kitchen facilities in 2022: 0.7%
House/condo owner moved in on average 9 years ago
Renter moved in on average 3 years ago
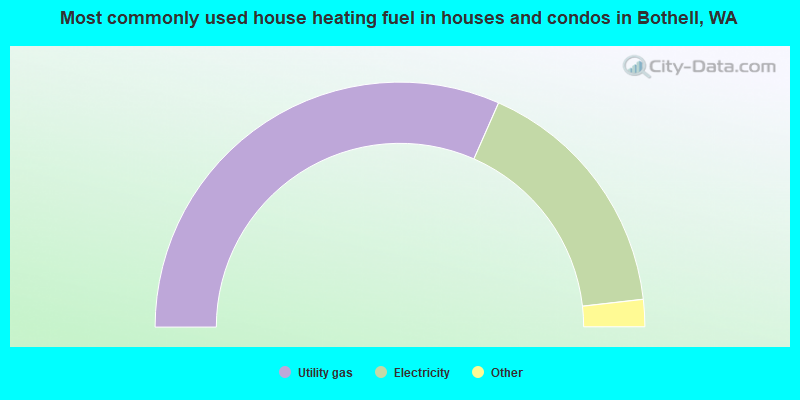
- 63.2%Utility gas
- 33.2%Electricity
- 1.7%Wood
- 1.0%Fuel oil, kerosene, etc.
- 0.9%Bottled, tank, or LP gas
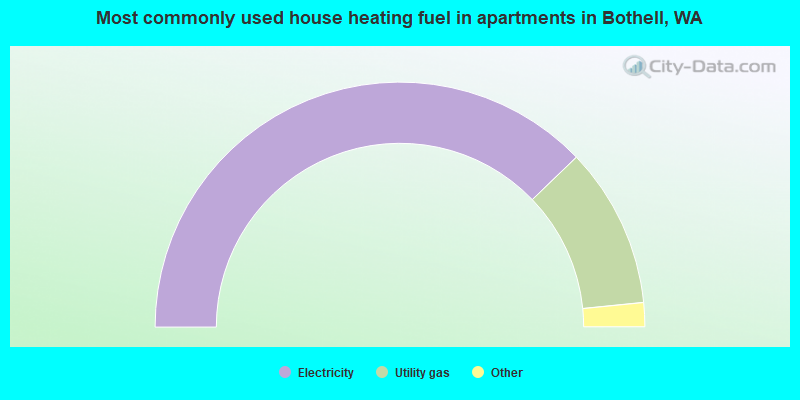
- 75.7%Electricity
- 21.2%Utility gas
- 1.4%Fuel oil, kerosene, etc.
- 0.7%Other fuel
- 0.5%Bottled, tank, or LP gas
- 0.3%No fuel used
- 0.2%Wood
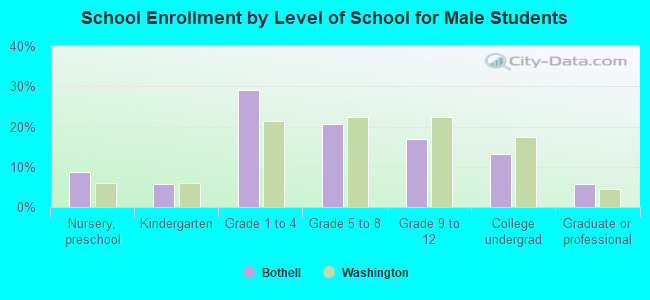
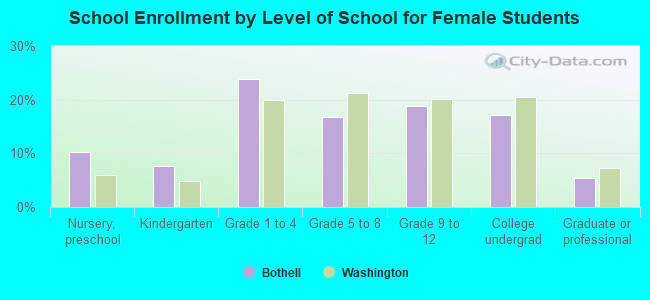
Private vs. public school enrollment:
| Here: | 15.3% |
| Washington: | 12.4% |
| Here: | 5.2% |
| Washington: | 9.2% |
| Here: | 14.8% |
| Washington: | 16.5% |