Boston, TN (Tennessee) Houses and Residents
| Boston: | $558,405 |
| Tennessee: | $284,800 |
Total population: 12,703 (Urban population: 5,075 (all inside urban clusters), Rural population: 4,685 (350 farm, 4,335 nonfarm))
Houses: 3,536 (3,321 occupied: 3,043 owner occupied, 278 renter occupied)
| % of renters here: | 8% |
| State: | 33% |
Housing density: 30 houses/condos per square mile
Median price asked for vacant for-sale houses and condos in 2022 in this county: $761,693.
Median contract rent in 2022: $1,378 (lower quartile is $1,010, upper quartile is over $2,000)
Median rent asked for vacant for-rent units in 2022: $992
Median gross rent in Boston, TN in 2022: $1,490
Housing units in Boston with a mortgage: 2,060 (216 second mortgage, 234 home equity loan, 0 both second mortgage and home equity loan)
Houses without a mortgage: 193
Compare current foreclosures near Boston, TN:
| Photo | Address | Area | Beds / Baths | Price | Details |
|---|---|---|---|---|---|

|
#1
Monoco Dr
Spring Hill, TN 37174
|
- sq. feet
|
2 baths 3 beds |
show details | |

|
#2
Remington Trl
Columbia, TN 38401
|
1,806 sq. feet
|
2 baths 4 beds |
show details | |

|
#3
Lequire Lane
Spring Hill, TN 37174
|
3,045 sq. feet
|
4 baths 6 beds |
show details | |

|
#4
Lakin Ln
Columbia, TN 38401
|
1,379 sq. feet
|
2 baths 3 beds |
show details | |

|
#5
Hudlow Ct
Fairview, TN 37062
|
1,540 sq. feet
|
3 baths - beds |
show details | |

|
#6
Meadow Ridge Cir
Nashville, TN 37221
|
2,298 sq. feet
|
3 baths 3 beds |
show details | |

|
#7
Parker Pl
Brentwood, TN 37027
|
2,040 sq. feet
|
2 baths - beds |
show details | |

|
#8
Yellow Wood Ct
Nashville, TN 37221
|
2,446 sq. feet
|
3 baths 3 beds |
show details | |

|
#9
Brandon Dr
Franklin, TN 37064
|
1,988 sq. feet
|
2 baths - beds |
show details | |

|
#10
Clara Mathis Rd
Spring Hill, TN 37174
|
1,525 sq. feet
|
1 baths - beds |
show details |
| Photo | Address | Area | Beds / Baths | Price | Details |
|---|---|---|---|---|---|

|
#11
Cold Harbor Ct
Fairview, TN 37062
|
3,726 sq. feet
|
4 baths - beds |
show details | |

|
#12
Ash Hill Rd
Spring Hill, TN 37174
|
1,620 sq. feet
|
2 baths - beds |
show details | |

|
#13
Valley Rd
Fairview, TN 37062
|
1,050 sq. feet
|
2 baths - beds |
show details | |

|
#14
White Oak Trl
Spring Hill, TN 37174
|
2,498 sq. feet
|
2 baths - beds |
show details | |

|
#15
Old Bethesda Duplex Rd
College Grove, TN 37046
|
1,056 sq. feet
|
1 baths - beds |
show details | |

|
#16
Brentwood Pointe
Franklin, TN 37067
|
2,042 sq. feet
|
2 baths - beds |
show details | |

|
#17
Allen Dr
Columbia, TN 38401
|
960 sq. feet
|
1 baths - beds |
show details | |

|
#18
Cumberland Dr
Columbia, TN 38401
|
1,300 sq. feet
|
1 baths - beds |
show details | |

|
#19
Churchill Pl
Franklin, TN 37067
|
2,527 sq. feet
|
2 baths - beds |
show details | |

|
#20
Buckingham Cir
Franklin, TN 37064
|
3,205 sq. feet
|
3 baths - beds |
show details |
| Photo | Address | Area | Beds / Baths | Price | Details |
|---|---|---|---|---|---|

|
#21
Mount Olivet Rd
Columbia, TN 38401
|
3,784 sq. feet
|
3 baths - beds |
show details | |

|
#22
Clara Mathis Rd
Spring Hill, TN 37174
|
1,782 sq. feet
|
2 baths - beds |
show details | |

|
#23
Highland Ave
Columbia, TN 38401
|
1,583 sq. feet
|
2 baths - beds |
show details | |

|
#24
Granger View Cir
Franklin, TN 37064
|
1,280 sq. feet
|
2 baths - beds |
show details | |

|
#25
Bear Creek Pike
Columbia, TN 38401
|
1,680 sq. feet
|
2 baths - beds |
show details | |

|
#26
Roderick Cir
Franklin, TN 37064
|
1,356 sq. feet
|
2 baths - beds |
show details | |

|
#27
1/2 Wheeler Dr
Columbia, TN 38401
|
1,300 sq. feet
|
1 baths - beds |
show details | |

|
#28
Pinehurst Dr
Columbia, TN 38401
|
1,360 sq. feet
|
2 baths - beds |
show details | |

|
#29
Vera Valley Rd
Franklin, TN 37064
|
2,191 sq. feet
|
3 baths - beds |
show details | |

|
#30
W Main St # 11
Franklin, TN 37064
|
1,276 sq. feet
|
2 baths - beds |
show details |
| Photo | Address | Area | Beds / Baths | Price | Details |
|---|---|---|---|---|---|

|
#31
Scribner Ave
Columbia, TN 38401
|
1,278 sq. feet
|
1 baths - beds |
show details | |

|
#32
Crestview Dr
Columbia, TN 38401
|
1,209 sq. feet
|
1 baths - beds |
show details | |

|
#33
Lee Dr
Columbia, TN 38401
|
2,118 sq. feet
|
1 baths - beds |
show details | |

|
#34
Nashville Hwy
Columbia, TN 38401
|
2,936 sq. feet
|
2 baths - beds |
show details | |

|
#35
W 17th St
Columbia, TN 38401
|
744 sq. feet
|
1 baths - beds |
show details | |

|
#36
Countrywood Dr
Franklin, TN 37064
|
1,389 sq. feet
|
2 baths - beds |
show details | |

|
#37
Andes Dr
Columbia, TN 38401
|
2,062 sq. feet
|
2 baths - beds |
show details | |

|
#38
Byrd Ln
College Grove, TN 37046
|
1,875 sq. feet
|
2 baths - beds |
show details | |

|
#39
Highland Ave
Columbia, TN 38401
|
744 sq. feet
|
1 baths - beds |
show details | |

|
#40
Iron Bridge Rd
Columbia, TN 38401
|
1,149 sq. feet
|
1 baths - beds |
show details |
| Photo | Address | Area | Beds / Baths | Price | Details |
|---|---|---|---|---|---|

|
#41
Lake Rd
Fairview, TN 37062
|
721 sq. feet
|
1 baths - beds |
show details | |

|
#42
Upland Dr
Franklin, TN 37067
|
1,669 sq. feet
|
3 baths - beds |
show details | |

|
#43
W 15th St
Columbia, TN 38401
|
948 sq. feet
|
1 baths - beds |
show details | |

|
#44
Maple Dr
Franklin, TN 37064
|
1,410 sq. feet
|
1 baths - beds |
show details | |

|
#45
Grammar Dr
Fairview, TN 37062
|
2,232 sq. feet
|
2 baths - beds |
show details | |

|
#46
Donra Way
Columbia, TN 38401
|
1,134 sq. feet
|
2 baths - beds |
show details | |

|
#47
Stanwick Dr
Franklin, TN 37067
|
3,274 sq. feet
|
3 baths - beds |
show details | |

|
#48
Bridlewood Trl
Franklin, TN 37067
|
3,225 sq. feet
|
4 baths - beds |
show details | |

|
#49
Parker St
Columbia, TN 38401
|
1,122 sq. feet
|
1 baths - beds |
show details | |

|
Check over 1 million property listings on Foreclosure.com!
|
browse all offers | |||

Household type by relationship:
Households: 182,029- In family households: 165,784 (40,734 male householders, 10,508 female householders)
44,172 spouses, 62,188 children (58,154 natural, 2,093 adopted, 1,941 stepchildren), 2,137 grandchildren, 841 brothers or sisters, 1,066 parents, foster children, 1,199 other relatives, 1,929 non-relatives
- In nonfamily households: 16,245 (5,441 male householders (4,303 living alone)), 8,203 female householders (7,202 living alone)), 2,601 nonrelatives
- In group quarters: 1,153 (1,104 institutionalized population)
31,386 married couples with children.
4,095 single-parent households (783 men, 3,312 women).
95.4% of residents of Boston speak English at home.
3.0% of residents speak Spanish at home (65% speak English very well, 18% speak English well, 14% speak English not well, 4% don't speak English at all).
1.1% of residents speak other Indo-European language at home (72% speak English very well, 16% speak English well, 12% speak English not well).
0.5% of residents speak Asian or Pacific Island language at home (81% speak English very well, 19% speak English not well).
Foreign born population: 1,294 (6.4%)
(82.6% of them are naturalized citizens)
| Here: | 7.1 |
| State: | 6.5 |
| Here: | 5.1 |
| State: | 4.4 |

- Bedrooms in owner-occupied houses and condos in Boston, Tennessee
- 2no bedroom
- 581 bedroom
- 3152 bedrooms
- 1,9933 bedrooms
- 6114 bedrooms
- 645+ bedrooms

- Bedrooms in renter-occupied apartments in Boston, Tennessee
- 0no bedroom
- 151 bedroom
- 1032 bedrooms
- 833 bedrooms
- 504 bedrooms
- 275+ bedrooms

- Cars and other vehicles available in Boston in owner-occupied houses/condos
- 76no vehicle
- 5211 vehicle
- 1,7442 vehicles
- 5433 vehicles
- 1044 vehicles
- 555+ vehicles

- Cars and other vehicles available in Boston in renter-occupied apartments
- 11no vehicle
- 761 vehicle
- 1232 vehicles
- 613 vehicles
- 74 vehicles
- 05+ vehicles

- Rooms in owner-occupied houses in Boston, Tennessee
- 01 room
- 112 rooms
- 403 rooms
- 2224 rooms
- 4525 rooms
- 5806 rooms
- 9957 rooms
- 4428 rooms
- 3019+ rooms

- Rooms in renter-occupied apartments in Boston, Tennessee
- 01 room
- 102 rooms
- 163 rooms
- 574 rooms
- 435 rooms
- 486 rooms
- 597 rooms
- 208 rooms
- 259+ rooms


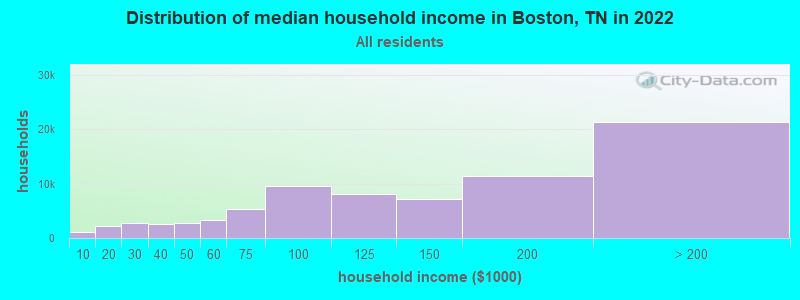
Boston, TN household income distribution

- 1,155Less than $10,000
- 2,158$10,000 to $19,999
- 2,739$20,000 to $29,999
- 2,608$30,000 to $39,999
- 2,693$40,000 to $49,999
- 3,240$50,000 to $59,999
- 5,421$60,000 to $74,999
- 9,493$75,000 to $99,999
- 8,128$100,000 to $124,999
- 7,149$125,000 to $149,999
- 11,431$150,000 to $199,999
- 21,367$200,000 or more
Percentage of workers working in this county: 79.8%
Number of people working at home: 763 (12.5% of all workers)
Travel time to work (commute)
- Less than 5 minutes: 43
- 5 to 9 minutes: 161
- 10 to 14 minutes: 290
- 15 to 19 minutes: 677
- 20 to 24 minutes: 846
- 25 to 29 minutes: 371
- 30 to 34 minutes: 685
- 35 to 39 minutes: 182
- 40 to 44 minutes: 275
- 45 to 59 minutes: 823
- 60 to 89 minutes: 260
- 90 or more minutes: 126
Means of transportation to work:
- Drove a car alone: 4,194 (85.1%)
- Carpooled: 497 (10.1%)
- Bicycle: 3 (0.1%)
- Walked: 13 (0.3%)
- Other means: 32 (0.6%)
- Worked at home: 191 (3.9%)


- Year of entry for the foreign-born population in Boston, Tennessee
- 411995 to March 2000
- 691990 to 1994
- 401985 to 1989
- 111980 to 1984
- 361975 to 1979
- 131970 to 1974
- 121965 to 1969
- 48Before 1965
Most common places of birth for foreign-born residents (%):
| Boston: | 21.9% (59) |
| Tennessee: | 0.8% (1,196) |
| Boston: | 18.9% (51) |
| Tennessee: | 3.6% (5,726) |
| Boston: | 14.1% (38) |
| Tennessee: | 1.1% (1,721) |
| Boston: | 6.3% (17) |
| Tennessee: | 4.8% (7,701) |
| Boston: | 5.6% (15) |
| Tennessee: | 0.4% (599) |
| Boston: | 5.6% (15) |
| Tennessee: | 0.5% (844) |
| Boston: | 4.4% (12) |
| Tennessee: | 0.4% (659) |
| Boston: | 4.1% (11) |
| Tennessee: | 5.2% (8,316) |
| Boston: | 4.1% (11) |
| Tennessee: | 3.8% (6,106) |
| Boston: | 4.1% (11) |
| Tennessee: | 4.4% (6,981) |
| Boston: | 3.7% (10) |
| Tennessee: | 0.6% (974) |
| Boston: | 3.0% (8) |
| Tennessee: | 0.8% (1,283) |
| Boston: | 2.2% (6) |
| Tennessee: | 28.1% (44,682) |
Place of birth for U.S.-born residents:
- This state: 4,696
- Other state: 4,694
- Northeast: 797
- Midwest: 1,625
- South: 1,873
- West: 399
43% of Boston residents lived in the same house 5 years ago.
Out of people who lived in different houses, 30% lived in this county.
Out of people who lived in different counties, 50% lived in Tennessee.
Education attainment for males 25 years and older:
- No schooling: 30
- Nursery to 4th grade: 12
- 5th and 6th grade: 41
- 7th and 8th grade: 186
- 9th grade: 36
- 10th grade: 42
- 11th grade: 77
- 12th grade, no diploma: 57
- High school graduate (or equivalency): 770
- Less than 1 year of college: 210
- Some college more than 1 year, no degree: 504
- Associate degree: 179
- Bachelor's degree: 671
- Master's degree: 137
- Professional school degree: 44
- Doctorate degree: 12

Education attainment for females 25 years and older:
- No schooling: 12
- Nursery to 4th grade: 3
- 5th and 6th grade: 27
- 7th and 8th grade: 116
- 9th grade: 65
- 10th grade: 93
- 11th grade: 70
- 12th grade, no diploma: 88
- High school graduate (or equivalency): 978
- Less than 1 year of college: 199
- Some college more than 1 year, no degree: 478
- Associate degree: 181
- Bachelor's degree: 611
- Master's degree: 149
- Professional school degree: 11
- Doctorate degree: 26


Housing units in structures:
- One, detached: 3,199
- One, attached: 8
- Two: 12
- 3 or 4: 10
- Mobile homes: 307
Median worth of mobile homes: $121,874
Housing units lacking complete kitchen facilities: 0.6%

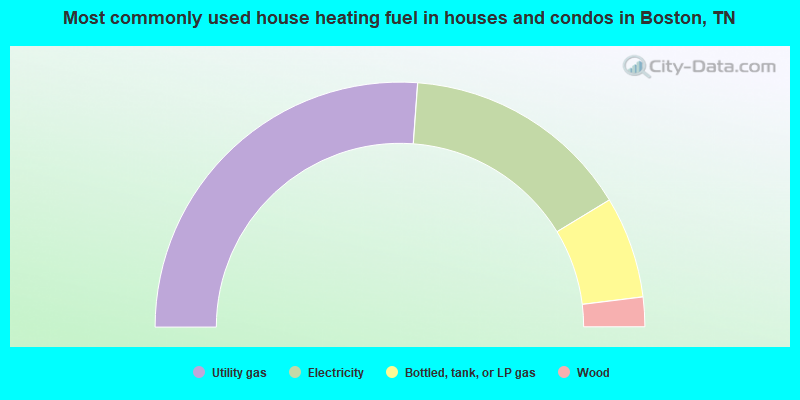
- 52.2%Utility gas
- 30.3%Electricity
- 13.4%Bottled, tank, or LP gas
- 3.9%Wood
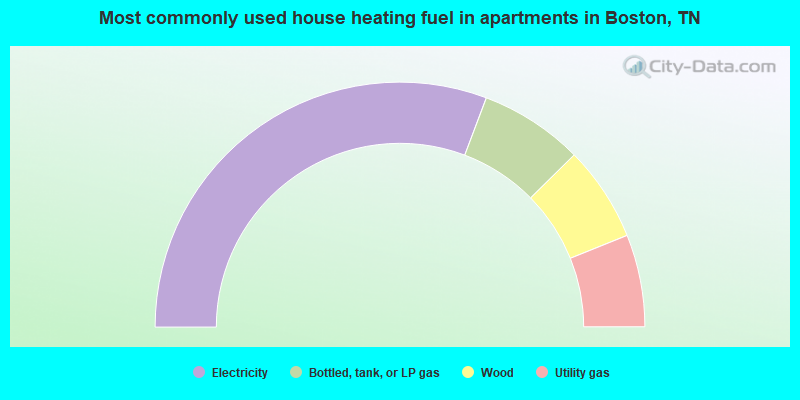
- 61.5%Electricity
- 13.7%Bottled, tank, or LP gas
- 12.6%Wood
- 12.2%Utility gas
Private vs. public school enrollment:
| Here: | 13.4% |
| Tennessee: | 9.5% |
| Here: | 6.4% |
| Tennessee: | 10.4% |
| Here: | 24.8% |
| Tennessee: | 22.8% |


