Blackfoot, ID (Idaho) Houses and Residents
| Blackfoot: | $278,334 |
| Idaho: | $432,500 |
Total population: 11,814 (Urban population: 10,218 (all inside urban clusters), Rural population: 218 (all nonfarm))
Houses: 4,634 (4,354 occupied: 3,013 owner occupied, 1,389 renter occupied)
| % of renters here: | 32% |
| State: | 28% |
Housing density: 857 houses/condos per square mile
Median price asked for vacant for-sale houses and condos in 2022: $264,212.
Median contract rent in 2022: $647 (lower quartile is $506, upper quartile is $927)
Median rent asked for vacant for-rent units in 2022: $2,668
Median gross rent in Blackfoot, ID in 2022: $822
Housing units in Blackfoot with a mortgage: 2,198 (260 second mortgage, 0 home equity loan, 205 both second mortgage and home equity loan)
Houses without a mortgage: 65
Median household income for houses/condos with a mortgage: $73,784
Median household income for apartments without a mortgage: $60,325
Median monthly housing costs: $938
Compare current foreclosures near Blackfoot, ID:
| Photo | Address | Area | Beds / Baths | Price | Details |
|---|---|---|---|---|---|

|
#1
Clifford St
Blackfoot, ID 83221
|
- sq. feet
|
2 baths 4 beds |
show details | |

|
#2
S Adams Ave
Blackfoot, ID 83221
|
- sq. feet
|
2 baths 4 beds |
show details | |

|
#3
W 265 N
Blackfoot, ID 83221
|
- sq. feet
|
- baths - beds |
show details | |

|
#4
Borreson St
Blackfoot, ID 83221
|
- sq. feet
|
- baths - beds |
show details | |

|
#5
N Shilling Ave Apt 3
Blackfoot, ID 83221
|
- sq. feet
|
- baths - beds |
show details | |

|
#6
W 170 N, Apt 2
Blackfoot, ID 83221
|
- sq. feet
|
- baths - beds |
show details | |

|
#7
Carol Dr Apt 1
Blackfoot, ID 83221
|
- sq. feet
|
- baths - beds |
show details | |

|
#8
N Adams Ave
Blackfoot, ID 83221
|
- sq. feet
|
- baths - beds |
show details | |

|
#9
W 100 N
Blackfoot, ID 83221
|
- sq. feet
|
- baths - beds |
show details | |

|
#10
Lawrence Ln # 702
Blackfoot, ID 83221
|
- sq. feet
|
- baths - beds |
show details |
| Photo | Address | Area | Beds / Baths | Price | Details |
|---|---|---|---|---|---|

|
#11
N Stout Ave
Blackfoot, ID 83221
|
- sq. feet
|
- baths - beds |
show details | |

|
#12
E 350 N
Blackfoot, ID 83221
|
- sq. feet
|
- baths - beds |
show details | |

|
#13
S Meridian St
Blackfoot, ID 83221
|
- sq. feet
|
- baths - beds |
show details | |

|
#14
S 250 E
Blackfoot, ID 83221
|
- sq. feet
|
- baths - beds |
show details | |

|
#15
E 350 N
Blackfoot, ID 83221
|
- sq. feet
|
- baths - beds |
show details | |

|
#16
Hepworth Ln
Blackfoot, ID 83221
|
- sq. feet
|
- baths - beds |
show details | |

|
#17
Connie Dr
Blackfoot, ID 83221
|
- sq. feet
|
- baths - beds |
show details | |

|
#18
N 100 W
Blackfoot, ID 83221
|
- sq. feet
|
- baths - beds |
show details | |

|
#19
Valley Dr
Blackfoot, ID 83221
|
- sq. feet
|
- baths - beds |
show details | |

|
#20
N 1300 W
Blackfoot, ID 83221
|
- sq. feet
|
- baths - beds |
show details |
| Photo | Address | Area | Beds / Baths | Price | Details |
|---|---|---|---|---|---|

|
#21
Gifford St
Blackfoot, ID 83221
|
- sq. feet
|
- baths - beds |
show details | |

|
#22
Horrocks Dr
Blackfoot, ID 83221
|
- sq. feet
|
- baths - beds |
show details | |

|
#23
6 Box
Pocatello, ID 83202
|
- sq. feet
|
- baths - beds |
show details | |

|
#24
S Mission Rd, Unit 16
Pocatello, ID 83202
|
- sq. feet
|
- baths - beds |
show details | |

|
#25
E 780 N
Shelley, ID 83274
|
- sq. feet
|
- baths - beds |
show details | |

|
#26
E 1200 N
Shelley, ID 83274
|
- sq. feet
|
- baths - beds |
show details | |

|
#27
S Park Ave
Shelley, ID 83274
|
- sq. feet
|
- baths - beds |
show details | |

|
Check over 1 million property listings on Foreclosure.com!
|
browse all offers | |||

Latest news about housing in Blackfoot, ID collected exclusively by city-data.com from local newspapers, TV, and radio stations

 | ****How is Pocatello? Why so many houses for sale in Blackfoot? (31 replies) |
| High rents have finally crashed landed in Idaho Falls (112 replies) |
| is Blackfoot a good place to raise kids? (3 replies) |
| Thoughts on the social climate and culture in the Panhandle? (35 replies) |
| Searching for sanctuary in Idaho (77 replies) |
| Conservative woman seeking peace in Idaho (57 replies) |

Median year apartment built: 1970
Household type by relationship:
Households: 12,914- Male householders: 1,727 (462 living alone), Female householders: 2,608 (693 living alone)
2,181 spouses (2,181 opposite-sex spouses), 368 unmarried partners, (368 opposite-sex unmarried partners), 4,206 children (3,940 natural, 71 adopted, 194 stepchildren), 449 grandchildren, 30 brothers or sisters, 201 parents, 0 foster children, 321 other relatives, 348 non-relatives
- In group quarters: 471
Size of family households: 1,127 2-persons, 717 3-persons, 462 4-persons, 495 5-persons, 135 6-persons, 115 7-or-more-persons.
Size of nonfamily households: 1,151 1-person, 177 2-persons.
2,157 married couples with children.
858 single-parent households (377 men, 481 women).
88.6% of residents of Blackfoot speak English at home.
10.6% of residents speak Spanish at home (64% speak English very well, 11% speak English well, 23% speak English not well, 2% don't speak English at all).
0.7% of residents speak other Indo-European language at home (100% speak English very well).
0.3% of residents speak other language at home (65% speak English very well, 19% speak English well, 16% speak English not well).
Foreign born population: 671 (5.2%)
(60.4% of them are naturalized citizens)
| Here: | 7.5 |
| State: | 6.5 |
| Here: | 4.5 |
| State: | 4.4 |

- Bedrooms in owner-occupied houses and condos in Blackfoot, Idaho
- 0no bedroom
- 541 bedroom
- 4232 bedrooms
- 1,0443 bedrooms
- 8734 bedrooms
- 6205+ bedrooms

- Bedrooms in renter-occupied apartments in Blackfoot, Idaho
- 49no bedroom
- 3081 bedroom
- 4122 bedrooms
- 4733 bedrooms
- 1064 bedrooms
- 415+ bedrooms

- Cars and other vehicles available in Blackfoot in owner-occupied houses/condos
- 263no vehicle
- 4591 vehicle
- 1,1312 vehicles
- 7813 vehicles
- 2844 vehicles
- 975+ vehicles

- Cars and other vehicles available in Blackfoot in renter-occupied apartments
- 75no vehicle
- 6211 vehicle
- 4512 vehicles
- 1253 vehicles
- 1004 vehicles
- 165+ vehicles

- Rooms in owner-occupied houses in Blackfoot, Idaho
- 01 room
- 402 rooms
- 03 rooms
- 1844 rooms
- 3765 rooms
- 5246 rooms
- 3407 rooms
- 3608 rooms
- 1,1909+ rooms

- Rooms in renter-occupied apartments in Blackfoot, Idaho
- 491 room
- 562 rooms
- 1653 rooms
- 4264 rooms
- 2845 rooms
- 1156 rooms
- 927 rooms
- 648 rooms
- 1399+ rooms


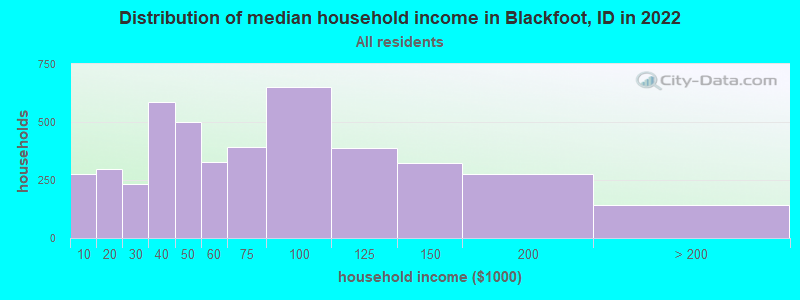
Blackfoot, ID household income distribution

- 275Less than $10,000
- 298$10,000 to $19,999
- 232$20,000 to $29,999
- 585$30,000 to $39,999
- 498$40,000 to $49,999
- 326$50,000 to $59,999
- 391$60,000 to $74,999
- 653$75,000 to $99,999
- 389$100,000 to $124,999
- 323$125,000 to $149,999
- 277$150,000 to $199,999
- 143$200,000 or more
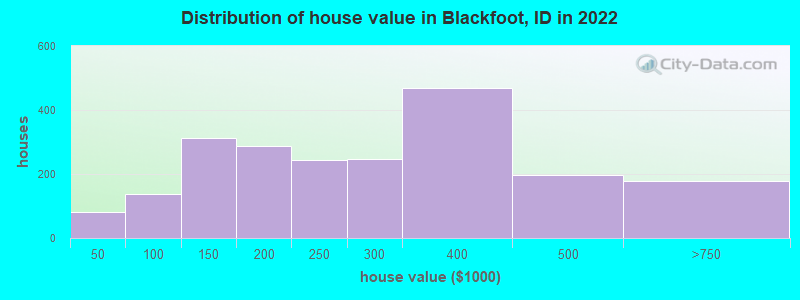
Home value of owner - occupied houses in 2022 in Blackfoot, ID
-
- 40Less than $10,000
- 30$10,000 to $14,999
- 9$35,000 to $39,999
- 7$50,000 to $59,999
- 18$60,000 to $69,999
- 12$70,000 to $79,999
- 52$80,000 to $89,999
- 47$90,000 to $99,999
- 65$100,000 to $124,999
- 247$125,000 to $149,999
- 124$150,000 to $174,999
- 163$175,000 to $199,999
- 242$200,000 to $249,999
- 247$250,000 to $299,999
- 468$300,000 to $399,999
- 196$400,000 to $499,999
- 179$500,000 to $749,999
Rent paid by renters in 2022 in Blackfoot, ID
-
- 35Less than $100
- 18$150 to $199
- 59$200 to $249
- 20$250 to $299
- 43$300 to $349
- 27$350 to $399
- 58$400 to $449
- 91$450 to $499
- 107$500 to $549
- 111$550 to $599
- 93$600 to $649
- 18$650 to $699
- 64$700 to $749
- 61$750 to $799
- 163$800 to $899
- 94$900 to $999
- 41$1,000 to $1,249
- 36No cash rent


Percentage of workers working in this county: 65.4%
Number of people working at home: 301 (5.8% of all workers)
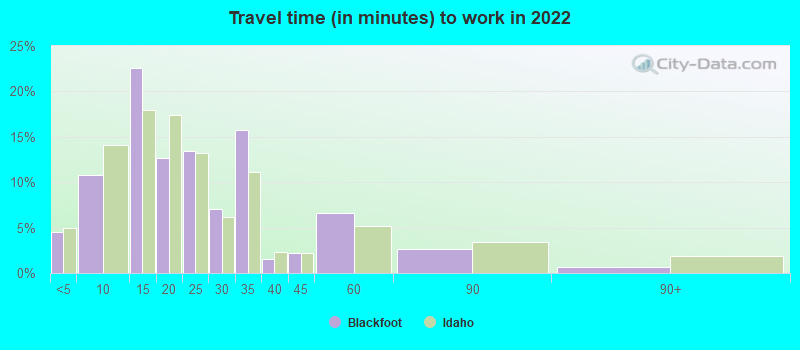
Travel time to work (commute)
- Less than 5 minutes: 302
- 5 to 9 minutes: 700
- 10 to 14 minutes: 1,057
- 15 to 19 minutes: 498
- 20 to 24 minutes: 125
- 25 to 29 minutes: 489
- 30 to 34 minutes: 690
- 35 to 39 minutes: 186
- 40 to 44 minutes: 173
- 45 to 59 minutes: 453
- 60 to 89 minutes: 169
- 90 or more minutes: 18
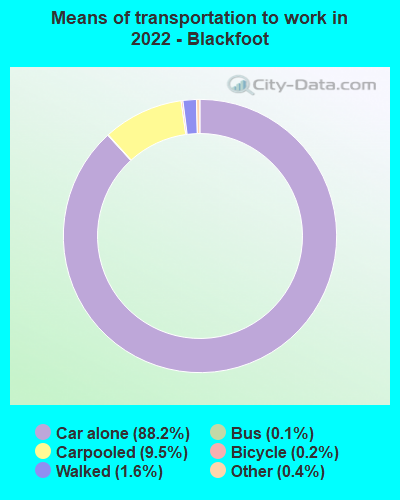
Means of transportation to work:
- Drove a car alone: 6,354 (81.9%)
- Carpooled: 729 (9.4%)
- Bus: 8 (0.1%)
- Taxi: 37 (0.5%)
- Bicycle: 11 (0.1%)
- Walked: 130 (1.7%)
- Worked at home: 301 (3.9%)

- Unemployment by race in 2022
- Unemployment rate for White non-Hispanic residents
- 5.3%Males
- 6.4%Females
- Unemployment rate for other race residents
- 22.2%Males
- 2.3%Females
- Unemployment rate for two or more race residents
- 21.7%Females
- Unemployment rate for Hispanic or Latino residents
- 17.2%Males
- 4.6%Females

- Year of entry for the foreign-born population in Blackfoot, Idaho
- 192010 or later
- 542000 to 2009
- 2641990 to 1999
- 2011980 to 1989
- 1041970 to 1979
- 63Before 1970

First ancestries reported:
- English: 1,172 (23.4%)
- American: 620 (12.4%)
- European: 281 (5.6%)
- Irish: 274 (5.5%)
- German: 232 (4.6%)
- Danish: 107 (2.1%)
- Swedish: 88 (1.8%)
- Italian: 85 (1.7%)
- Scottish: 72 (1.4%)
- Norwegian: 59 (1.2%)
- Northern European: 50 (1.0%)
- Portuguese: 38 (0.8%)
- French Canadian: 34 (0.7%)
- British: 20 (0.4%)
- Hungarian: 20 (0.4%)
- Welsh: 20 (0.4%)
- Basque: 16 (0.3%)
- Czechoslovakian: 12 (0.2%)
- Scotch-Irish: 9 (0.2%)
- Dutch: 7 (0.1%)
Most common places of birth for foreign-born residents (%):
| Blackfoot: | 74.4% (467) |
| Idaho: | 49.9% (53,107) |
| Blackfoot: | 10.0% (63) |
| Idaho: | 5.2% (5,503) |
| Blackfoot: | 5.7% (36) |
| Idaho: | 0.3% (346) |
| Blackfoot: | 4.9% (31) |
| Idaho: | 0.1% (139) |
| Blackfoot: | 3.7% (23) |
| Idaho: | 0.1% (95) |
Place of birth for U.S.-born residents:
- This state: 7,455
- Other state: 4,609
- Northeast: 140
- Midwest: 550
- South: 556
- West: 3,376
83.4% of Blackfoot residents lived in the same house 1 years ago.
Out of people who lived in different houses, 34.5% lived in this county.
Out of people who lived in different counties, 64.4% lived in Idaho.
| Blackfoot: | 83.4% |
| State average: | 85.1% |
Education attainment for males 25 years and older:
- No schooling: 23
- Nursery to 4th grade: 78
- 5th and 6th grade: 75
- 7th and 8th grade: 4
- 9th grade: 64
- 10th grade: 109
- 11th grade: 102
- 12th grade, no diploma: 101
- High school graduate (or equivalency): 1,149
- Less than 1 year of college: 216
- Some college more than 1 year, no degree: 590
- Associate degree: 427
- Bachelor's degree: 518
- Master's degree: 272
- Professional school degree: 102
- Doctorate degree: 8

Education attainment for females 25 years and older:
- No schooling: 0
- Nursery to 4th grade: 9
- 5th and 6th grade: 37
- 7th and 8th grade: 16
- 9th grade: 17
- 10th grade: 105
- 11th grade: 25
- 12th grade, no diploma: 55
- High school graduate (or equivalency): 1,593
- Less than 1 year of college: 296
- Some college more than 1 year, no degree: 621
- Associate degree: 373
- Bachelor's degree: 806
- Master's degree: 157
- Professional school degree: 32
- Doctorate degree: 35


Housing units in structures:
- One, detached: 3,564
- One, attached: 127
- Two: 87
- 3 or 4: 455
- 5 to 9: 150
- 20 to 49: 8
- 50 or more: 48
- Mobile homes: 180
- Boats, RVs, vans, etc.: 12
Median worth of mobile homes: $13,495
House/condo owner moved in on average 9 years ago
Renter moved in on average 5 years ago

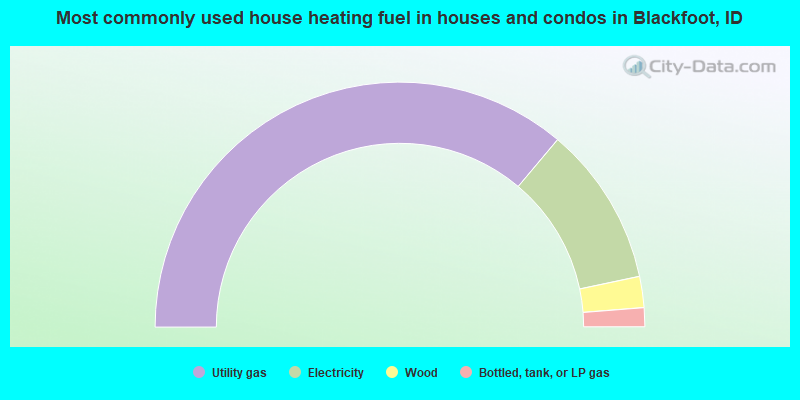
- 72.2%Utility gas
- 21.1%Electricity
- 4.1%Wood
- 2.5%Bottled, tank, or LP gas
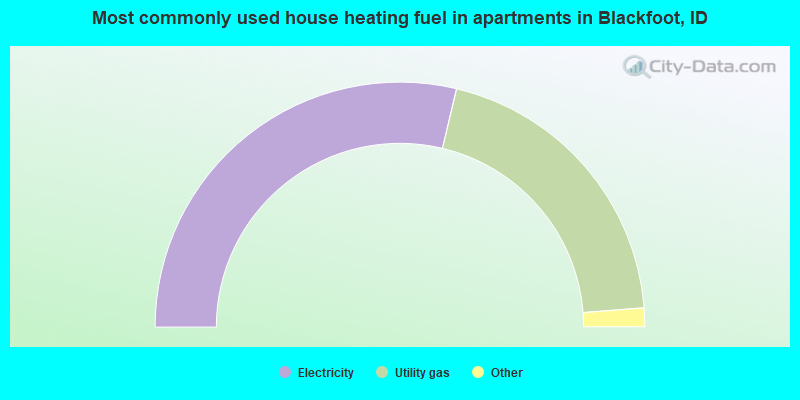
- 57.5%Electricity
- 40.1%Utility gas
- 1.5%Fuel oil, kerosene, etc.
- 0.8%Wood
Private vs. public school enrollment:
| Here: | 2.3% |
| Idaho: | 13.5% |
| Here: | 5.9% |
| Idaho: | 8.5% |
| Here: | 37.2% |
| Idaho: | 30.0% |


