Belvidere, IL (Illinois) Houses and Residents
| Belvidere: | $146,372 |
| Illinois: | $251,600 |
Mean price in 2022:
Detached houses: $160,734
Here: $160,734 State: $310,164 Townhouses or other attached units: $145,624
Here: $145,624 State: $286,230 In 2-unit structures: $200,863
Here: $200,863 State: $299,638 In 5-or-more-unit structures: $106,846
Here: $106,846 State: $318,887 Mobile homes: $63,541
Here: $63,541 State: $78,855
Total population: 25,282 (Urban population: 20,005, Rural population: 693 (all nonfarm))
Houses: 10,265 (9,758 occupied: 7,329 owner occupied, 2,555 renter occupied)
| % of renters here: | 26% |
| State: | 33% |
Housing density: 1,132 houses/condos per square mile
Median price asked for vacant for-sale houses and condos in 2022 in this county: $100,788.
Median contract rent in 2022: $724 (lower quartile is $496, upper quartile is $990)
Median rent asked for vacant for-rent units in 2022: $483
Median gross rent in Belvidere, IL in 2022: $907
Housing units in Belvidere with a mortgage: 4,428 (306 second mortgage, 98 home equity loan, 180 both second mortgage and home equity loan)
Houses without a mortgage: 115
Median household income for houses/condos with a mortgage: $72,882
Median household income for apartments without a mortgage: $58,388
Median monthly housing costs: $983
Compare current foreclosures in Belvidere, IL:
| Photo | Address | Area | Beds / Baths | Price | Details |
|---|---|---|---|---|---|

|
#1
Kishwaukee St
Belvidere, IL 61008
|
2,032 sq. feet
|
2 baths 5 beds |
show details | |

|
#2
Broadview Ave
Belvidere, IL 61008
|
1,958 sq. feet
|
2 baths 3 beds |
show details | |

|
#3
W 10th St
Belvidere, IL 61008
|
2,128 sq. feet
|
1 baths - beds |
show details | |

|
#4
W Madison St
Belvidere, IL 61008
|
3,044 sq. feet
|
2 baths 5 beds |
show details | |

|
#5
Bliss St
Belvidere, IL 61008
|
2,100 sq. feet
|
2 baths 3 beds |
show details | |

|
#6
E Perry St
Belvidere, IL 61008
|
1,356 sq. feet
|
1 baths 2 beds |
show details | |

|
#7
Willowbrook Dr
Belvidere, IL 61008
|
- sq. feet
|
2 baths 3 beds |
show details | |

|
#8
Hearthstone Ln
Belvidere, IL 61008
|
- sq. feet
|
2 baths 3 beds |
show details | |

|
#9
Ricky Trl
Belvidere, IL 61008
|
- sq. feet
|
1 baths 3 beds |
show details | |

|
#10
W Chrysler Dr
Belvidere, IL 61008
|
- sq. feet
|
2 baths 2 beds |
show details |
| Photo | Address | Area | Beds / Baths | Price | Details |
|---|---|---|---|---|---|

|
#11
Biester Dr
Belvidere, IL 61008
|
- sq. feet
|
1 baths 3 beds |
show details | |

|
#12
Van Buren St
Belvidere, IL 61008
|
- sq. feet
|
- baths 4 beds |
show details | |

|
#13
Nettie St Apt 409
Belvidere, IL 61008
|
- sq. feet
|
- baths - beds |
show details | |

|
#14
9th Ave
Belvidere, IL 61008
|
- sq. feet
|
- baths - beds |
show details | |

|
#15
Pondview Dr
Belvidere, IL 61008
|
- sq. feet
|
- baths - beds |
show details | |

|
#16
12th Ave
Belvidere, IL 61008
|
- sq. feet
|
- baths - beds |
show details | |

|
#17
Christi Ln Apt 5
Belvidere, IL 61008
|
- sq. feet
|
- baths - beds |
show details | |

|
#18
9th Ave
Belvidere, IL 61008
|
- sq. feet
|
- baths - beds |
show details | |

|
#19
Willow St
Belvidere, IL 61008
|
- sq. feet
|
- baths - beds |
show details | |

|
#20
E Lincoln Ave
Belvidere, IL 61008
|
- sq. feet
|
- baths - beds |
show details |
| Photo | Address | Area | Beds / Baths | Price | Details |
|---|---|---|---|---|---|

|
#21
S Main St
Belvidere, IL 61008
|
- sq. feet
|
- baths - beds |
show details | |

|
#22
Pearl St Apt 216
Belvidere, IL 61008
|
- sq. feet
|
- baths - beds |
show details | |

|
#23
Club Cir
Belvidere, IL 61008
|
- sq. feet
|
- baths - beds |
show details | |

|
#24
Helen St
Belvidere, IL 61008
|
- sq. feet
|
- baths 3 beds |
show details | |

|
#25
Iris Ave
Belvidere, IL 61008
|
- sq. feet
|
- baths - beds |
show details | |

|
#26
Il Route 76
Belvidere, IL 61008
|
- sq. feet
|
- baths - beds |
show details | |

|
#27
Park Ave
Belvidere, IL 61008
|
- sq. feet
|
- baths - beds |
show details | |

|
#28
S Main St
Belvidere, IL 61008
|
- sq. feet
|
- baths - beds |
show details | |

|
#29
Greenview Rd
Belvidere, IL 61008
|
- sq. feet
|
- baths - beds |
show details | |

|
#30
Fairgrounds Rd # 14
Belvidere, IL 61008
|
- sq. feet
|
- baths - beds |
show details |
| Photo | Address | Area | Beds / Baths | Price | Details |
|---|---|---|---|---|---|

|
#31
8th Ave
Belvidere, IL 61008
|
- sq. feet
|
- baths - beds |
show details | |

|
#32
N State St
Belvidere, IL 61008
|
- sq. feet
|
- baths - beds |
show details | |

|
#33
Park Ave
Belvidere, IL 61008
|
- sq. feet
|
- baths - beds |
show details | |

|
#34
Logan Ave
Belvidere, IL 61008
|
- sq. feet
|
- baths - beds |
show details | |

|
#35
Elder Ln
Belvidere, IL 61008
|
- sq. feet
|
- baths - beds |
show details | |

|
#36
E 6th St
Belvidere, IL 61008
|
- sq. feet
|
- baths - beds |
show details | |

|
#37
Park Ave
Belvidere, IL 61008
|
- sq. feet
|
- baths - beds |
show details | |

|
#38
15th Ave
Belvidere, IL 61008
|
- sq. feet
|
- baths - beds |
show details | |

|
#39
11th Ave
Belvidere, IL 61008
|
- sq. feet
|
- baths - beds |
show details | |

|
#40
Florence Ct
Belvidere, IL 61008
|
- sq. feet
|
- baths - beds |
show details |
| Photo | Address | Area | Beds / Baths | Price | Details |
|---|---|---|---|---|---|

|
#41
Royal Ave
Belvidere, IL 61008
|
- sq. feet
|
- baths - beds |
show details | |

|
#42
Prairie Rd
Belvidere, IL 61008
|
- sq. feet
|
- baths - beds |
show details | |

|
#43
Ruby St
Belvidere, IL 61008
|
- sq. feet
|
- baths - beds |
show details | |

|
#44
W Madison St
Belvidere, IL 61008
|
- sq. feet
|
- baths - beds |
show details | |

|
#45
Piel Grocery Ln
Belvidere, IL 61008
|
- sq. feet
|
- baths - beds |
show details | |

|
#46
W Harrison St
Belvidere, IL 61008
|
- sq. feet
|
- baths - beds |
show details | |

|
#47
Vestas Pl
Belvidere, IL 61008
|
- sq. feet
|
- baths - beds |
show details | |

|
#48
Galloway Ln
Belvidere, IL 61008
|
- sq. feet
|
- baths - beds |
show details | |

|
#49
Caswell St
Belvidere, IL 61008
|
- sq. feet
|
- baths - beds |
show details | |

|
Check over 1 million property listings on Foreclosure.com!
|
browse all offers | |||

Latest news about housing in Belvidere, IL collected exclusively by city-data.com from local newspapers, TV, and radio stations


Median year apartment built: 1972
Household type by relationship:
Households: 25,039- Male householders: 5,207 (1,317 living alone), Female householders: 4,372 (1,531 living alone)
3,790 spouses (3,776 opposite-sex spouses), 1,020 unmarried partners, (915 opposite-sex unmarried partners), 7,867 children (7,337 natural, 32 adopted, 497 stepchildren), 809 grandchildren, 213 brothers or sisters, 244 parents, 64 foster children, 294 other relatives, 922 non-relatives
- In group quarters: 232
Size of family households: 2,398 2-persons, 1,332 3-persons, 1,101 4-persons, 799 5-persons, 199 6-persons, 168 7-or-more-persons.
Size of nonfamily households: 3,000 1-person, 664 2-persons, 172 3-persons, 30 4-persons.
2,377 married couples with children.
2,148 single-parent households (750 men, 1,398 women).
68.7% of residents of Belvidere speak English at home.
29.5% of residents speak Spanish at home (58% speak English very well, 19% speak English well, 16% speak English not well, 7% don't speak English at all).
0.5% of residents speak other Indo-European language at home (71% speak English very well, 8% speak English well, 18% speak English not well, 3% don't speak English at all).
0.6% of residents speak Asian or Pacific Island language at home (52% speak English very well, 48% speak English not well).
0.5% of residents speak other language at home (100% speak English very well).
Foreign born population: 4,106 (16.4%)
(45.2% of them are naturalized citizens)
| Here: | 5.8 |
| State: | 6.4 |
| Here: | 4.1 |
| State: | 4.1 |

- Bedrooms in owner-occupied houses and condos in Belvidere, Illinois
- 103no bedroom
- 1011 bedroom
- 1,6462 bedrooms
- 3,9463 bedrooms
- 1,2574 bedrooms
- 2785+ bedrooms

- Bedrooms in renter-occupied apartments in Belvidere, Illinois
- 98no bedroom
- 6121 bedroom
- 1,2552 bedrooms
- 5493 bedrooms
- 434 bedrooms
- 05+ bedrooms

- Cars and other vehicles available in Belvidere in owner-occupied houses/condos
- 194no vehicle
- 2,1751 vehicle
- 3,0242 vehicles
- 1,1493 vehicles
- 5924 vehicles
- 1955+ vehicles

- Cars and other vehicles available in Belvidere in renter-occupied apartments
- 478no vehicle
- 1,2901 vehicle
- 5972 vehicles
- 1203 vehicles
- 694 vehicles
- 05+ vehicles

- Rooms in owner-occupied houses in Belvidere, Illinois
- 901 room
- 132 rooms
- 2673 rooms
- 1,0524 rooms
- 1,7395 rooms
- 1,4886 rooms
- 1,1247 rooms
- 8428 rooms
- 7159+ rooms

- Rooms in renter-occupied apartments in Belvidere, Illinois
- 981 room
- 552 rooms
- 6433 rooms
- 6854 rooms
- 3725 rooms
- 2096 rooms
- 2717 rooms
- 1678 rooms
- 569+ rooms


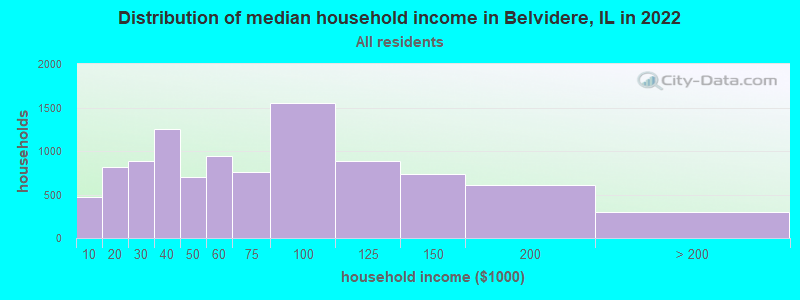
Belvidere, IL household income distribution

- 476Less than $10,000
- 814$10,000 to $19,999
- 886$20,000 to $29,999
- 1,258$30,000 to $39,999
- 699$40,000 to $49,999
- 948$50,000 to $59,999
- 761$60,000 to $74,999
- 1,552$75,000 to $99,999
- 882$100,000 to $124,999
- 738$125,000 to $149,999
- 607$150,000 to $199,999
- 303$200,000 or more
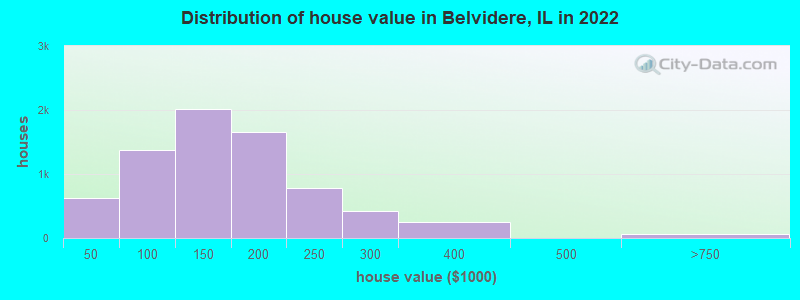
Home value of owner - occupied houses in 2022 in Belvidere, IL
-
- 135Less than $10,000
- 31$10,000 to $14,999
- 73$15,000 to $19,999
- 125$20,000 to $24,999
- 41$25,000 to $29,999
- 38$30,000 to $34,999
- 177$40,000 to $49,999
- 166$50,000 to $59,999
- 182$60,000 to $69,999
- 390$70,000 to $79,999
- 193$80,000 to $89,999
- 271$90,000 to $99,999
- 1,134$100,000 to $124,999
- 886$125,000 to $149,999
- 1,161$150,000 to $174,999
- 499$175,000 to $199,999
- 786$200,000 to $249,999
- 422$250,000 to $299,999
- 246$300,000 to $399,999
- 46$500,000 to $749,999
- 23$1,000,000 to $1,499,999
Rent paid by renters in 2022 in Belvidere, IL
-
- 114$150 to $199
- 43$200 to $249
- 47$250 to $299
- 55$300 to $349
- 207$350 to $399
- 24$400 to $449
- 126$450 to $499
- 72$500 to $549
- 121$550 to $599
- 229$600 to $649
- 25$650 to $699
- 270$700 to $749
- 86$750 to $799
- 333$800 to $899
- 134$900 to $999
- 428$1,000 to $1,249
- 100$1,250 to $1,499
- 63$1,500 to $1,999
- 16$2,000 to $2,499
- 20No cash rent


Percentage of workers working in this county: 42.8%
Number of people working at home: 741 (6.0% of all workers)
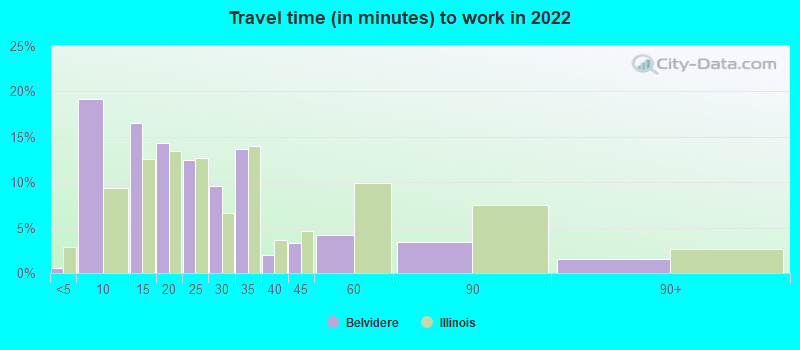
Travel time to work (commute)
- Less than 5 minutes: 156
- 5 to 9 minutes: 2,367
- 10 to 14 minutes: 1,724
- 15 to 19 minutes: 969
- 20 to 24 minutes: 1,576
- 25 to 29 minutes: 997
- 30 to 34 minutes: 1,427
- 35 to 39 minutes: 492
- 40 to 44 minutes: 195
- 45 to 59 minutes: 717
- 60 to 89 minutes: 561
- 90 or more minutes: 230
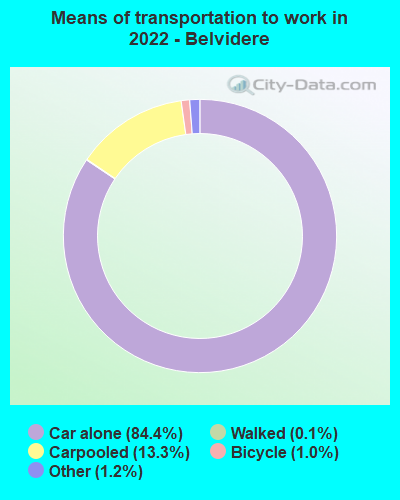
Means of transportation to work:
- Drove a car alone: 8,925 (77.3%)
- Carpooled: 1,501 (13.0%)
- Taxi: 140 (1.2%)
- Bicycle: 111 (1.0%)
- Walked: 14 (0.1%)
- Worked at home: 741 (6.4%)

- Unemployment by race in 2022
- Unemployment rate for White non-Hispanic residents
- 4.3%Males
- 4.0%Females
- Unemployment rate for Black residents
- 17.7%Males
- 29.3%Females
- Unemployment rate for Asian residents
- 0.5%Males
- Unemployment rate for other race residents
- 3.0%Males
- 8.6%Females
- Unemployment rate for two or more race residents
- 16.8%Males
- Unemployment rate for Hispanic or Latino residents
- 5.2%Males
- 3.9%Females

- Year of entry for the foreign-born population in Belvidere, Illinois
- 4902010 or later
- 1,0272000 to 2009
- 1,3421990 to 1999
- 6321980 to 1989
- 2841970 to 1979
- 263Before 1970
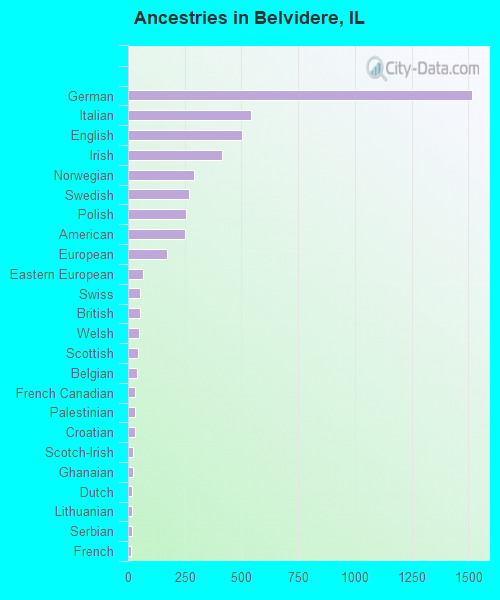
First ancestries reported:
- German: 1,515 (12.1%)
- Italian: 541 (4.3%)
- English: 501 (4.0%)
- Irish: 413 (3.3%)
- Norwegian: 293 (2.3%)
- Swedish: 271 (2.2%)
- Polish: 257 (2.1%)
- American: 253 (2.0%)
- European: 173 (1.4%)
- Eastern European: 66 (0.5%)
- Swiss: 55 (0.4%)
- British: 54 (0.4%)
- Welsh: 50 (0.4%)
- Scottish: 46 (0.4%)
- Belgian: 40 (0.3%)
- French Canadian: 33 (0.3%)
- Palestinian: 31 (0.2%)
- Croatian: 29 (0.2%)
- Scotch-Irish: 24 (0.2%)
- Ghanaian: 21 (0.2%)
- Dutch: 17 (0.1%)
- Lithuanian: 17 (0.1%)
- Serbian: 16 (0.1%)
- French: 14 (0.1%)
- Czech: 7 (0.06%)
- Haitian: 7 (0.06%)
- Greek: 6 (0.05%)
Most common places of birth for foreign-born residents (%):
| Belvidere: | 85.0% (3,491) |
| Illinois: | 34.7% (626,958) |
| Belvidere: | 2.3% (93) |
| Illinois: | 5.2% (93,003) |
| Belvidere: | 2.2% (92) |
| Illinois: | 2.2% (40,393) |
| Belvidere: | 1.7% (68) |
| Illinois: | 0.2% (3,512) |
Place of birth for U.S.-born residents:
- This state: 17,202
- Other state: 3,652
- Northeast: 295
- Midwest: 2,044
- South: 648
- West: 680
94.5% of Belvidere residents lived in the same house 1 years ago.
Out of people who lived in different houses, 28.9% lived in this county.
Out of people who lived in different counties, 65.7% lived in Illinois.
| Belvidere: | 94.5% |
| State average: | 88.3% |
Education attainment for males 25 years and older:
- No schooling: 412
- Nursery to 4th grade: 168
- 5th and 6th grade: 267
- 7th and 8th grade: 70
- 9th grade: 109
- 10th grade: 227
- 11th grade: 396
- 12th grade, no diploma: 342
- High school graduate (or equivalency): 2,981
- Less than 1 year of college: 713
- Some college more than 1 year, no degree: 1,108
- Associate degree: 566
- Bachelor's degree: 729
- Master's degree: 181
- Professional school degree: 0
- Doctorate degree: 24

Education attainment for females 25 years and older:
- No schooling: 589
- Nursery to 4th grade: 205
- 5th and 6th grade: 342
- 7th and 8th grade: 71
- 9th grade: 117
- 10th grade: 92
- 11th grade: 137
- 12th grade, no diploma: 290
- High school graduate (or equivalency): 2,958
- Less than 1 year of college: 597
- Some college more than 1 year, no degree: 1,354
- Associate degree: 544
- Bachelor's degree: 667
- Master's degree: 397
- Professional school degree: 87
- Doctorate degree: 82


Housing units in structures:
- One, detached: 6,761
- One, attached: 701
- Two: 668
- 3 or 4: 462
- 5 to 9: 198
- 10 to 19: 124
- 20 to 49: 37
- 50 or more: 327
- Mobile homes: 984
Median worth of mobile homes: $59,061
Housing units lacking complete kitchen facilities in 2022: 3.2%
House/condo owner moved in on average 10 years ago
Renter moved in on average 6 years ago

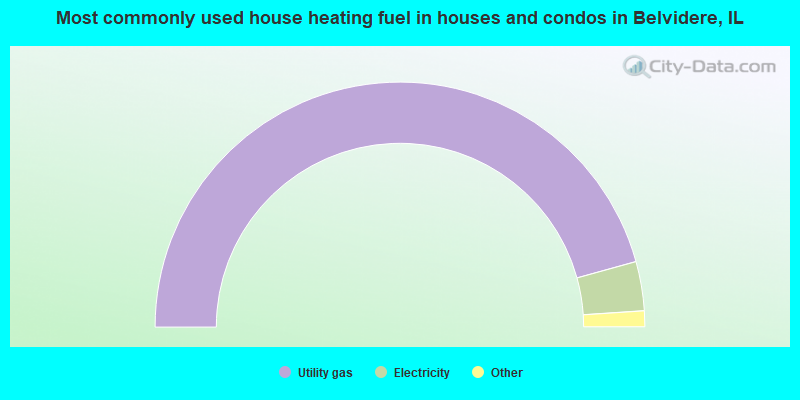
- 91.5%Utility gas
- 6.5%Electricity
- 1.7%Bottled, tank, or LP gas
- 0.3%Solar energy
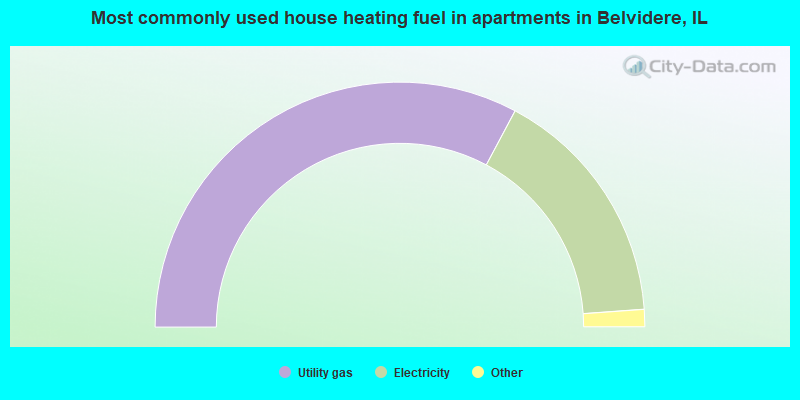
- 65.6%Utility gas
- 32.1%Electricity
- 1.9%Other fuel
- 0.4%No fuel used
Private vs. public school enrollment:
| Here: | 12.0% |
| Illinois: | 13.3% |
| Here: | 4.8% |
| Illinois: | 9.9% |
| Here: | 7.4% |
| Illinois: | 27.4% |


