Beltsville, MD (Maryland) Houses and Residents
| Beltsville: | $402,811 |
| Maryland: | $398,100 |
Total population: 16,772 (Urban population: 15,725, Rural population: 0)
Houses: 6,819 (6,361 occupied: 3,662 owner occupied, 2,727 renter occupied)
| % of renters here: | 43% |
| State: | 32% |
Housing density: 1,029 houses/condos per square mile
Median price asked for vacant for-sale houses and condos in 2022: $369,268.
Median contract rent in 2022: $1,939 (lower quartile is $1,566, upper quartile is over $2,000)
Median rent asked for vacant for-rent units in 2022: $2,846
Median gross rent in Beltsville, MD in 2022: over $2,000
Housing units in Beltsville with a mortgage: 2,277 (331 second mortgage, 0 home equity loan, 277 both second mortgage and home equity loan)
Houses without a mortgage: 132
Median household income for houses/condos with a mortgage: $113,373
Median household income for apartments without a mortgage: $102,519
Median monthly housing costs: $1,874
Compare current foreclosures near Beltsville, MD:
| Photo | Address | Area | Beds / Baths | Price | Details |
|---|---|---|---|---|---|

|
#1
Caverly Pl
Beltsville, MD 20705
|
2,148 sq. feet
|
2 baths - beds |
show details | |

|
#2
Hartford Ave
Beltsville, MD 20705
|
1,137 sq. feet
|
2 baths - beds |
show details | |

|
#3
Quimby Ave
Beltsville, MD 20705
|
980 sq. feet
|
2 baths - beds |
show details | |

|
#4
Rosedale Ln
Beltsville, MD 20705
|
1,520 sq. feet
|
1 baths - beds |
show details | |

|
#5
Ingleside Dr
Beltsville, MD 20705
|
2,089 sq. feet
|
2 baths - beds |
show details | |

|
#6
Ledo Creek Ter
Beltsville, MD 20705
|
2,846 sq. feet
|
2 baths - beds |
show details | |

|
#7
Gordon Ave
Beltsville, MD 20705
|
2,516 sq. feet
|
2 baths - beds |
show details | |

|
#8
Ridgewell Ct
Beltsville, MD 20705
|
2,067 sq. feet
|
2 baths - beds |
show details | |

|
#9
Fullerton St
Beltsville, MD 20705
|
2,089 sq. feet
|
2 baths - beds |
show details | |

|
#10
Stonehall Dr
Beltsville, MD 20705
|
2,089 sq. feet
|
2 baths - beds |
show details |
| Photo | Address | Area | Beds / Baths | Price | Details |
|---|---|---|---|---|---|

|
#11
Running Bear Ct
Beltsville, MD 20705
|
1,240 sq. feet
|
2 baths - beds |
show details | |

|
#12
Montgomery Ct
Beltsville, MD 20705
|
1,175 sq. feet
|
3 baths - beds |
show details | |

|
#13
Brewer Rd
Beltsville, MD 20705
|
1,109 sq. feet
|
2 baths - beds |
show details | |

|
#14
Fullerton St
Beltsville, MD 20705
|
2,089 sq. feet
|
2 baths - beds |
show details | |

|
#15
Barbara Dr
Beltsville, MD 20705
|
2,376 sq. feet
|
2 baths - beds |
show details | |

|
#16
Heartwood Dr
Beltsville, MD 20705
|
2,596 sq. feet
|
2 baths - beds |
show details | |

|
#17
Evans Trail Way
Beltsville, MD 20705
|
1,240 sq. feet
|
2 baths - beds |
show details | |

|
#18
Manheim Ave
Beltsville, MD 20705
|
1,008 sq. feet
|
1 baths - beds |
show details | |

|
#19
Josephine Ave
Beltsville, MD 20705
|
2,184 sq. feet
|
2 baths - beds |
show details | |

|
#20
Longwood Dr
Beltsville, MD 20705
|
2,380 sq. feet
|
2 baths - beds |
show details |
| Photo | Address | Area | Beds / Baths | Price | Details |
|---|---|---|---|---|---|

|
#21
Wellford Dr
Beltsville, MD 20705
|
1,778 sq. feet
|
2 baths - beds |
show details | |

|
#22
Cherry Hill Rd Apt T3
Beltsville, MD 20705
|
- sq. feet
|
- baths - beds |
show details | |

|
#23
Lincoln Ave
Beltsville, MD 20705
|
- sq. feet
|
- baths - beds |
show details | |

|
#24
Beltsville Dr Apt 35
Beltsville, MD 20705
|
- sq. feet
|
- baths - beds |
show details | |

|
#25
Virginia Manor Rd
Beltsville, MD 20705
|
- sq. feet
|
- baths - beds |
show details | |

|
#26
Cherry Hill Rd Unit 201
Beltsville, MD 20705
|
989 sq. feet
|
- baths - beds |
show details | |

|
#27
Weeping Willow Ln
Beltsville, MD 20705
|
- sq. feet
|
- baths - beds |
show details | |

|
#28
Cherry Hill Rd Unit 303
Beltsville, MD 20705
|
1,296 sq. feet
|
- baths - beds |
show details | |

|
#29
Usange St
Beltsville, MD 20705
|
- sq. feet
|
- baths - beds |
show details | |

|
#30
Brooke Knolls Rd
Gaithersburg, MD 20882
|
1,704 sq. feet
|
3 baths 4 beds |
$681,500
|
show details |
| Photo | Address | Area | Beds / Baths | Price | Details |
|---|---|---|---|---|---|

|
#31
Interlachen Dr Apt 111
Silver Spring, MD 20906
|
965 sq. feet
|
1 baths 2 beds |
$148,000
|
show details |

|
#32
Henson Ln
Temple Hills, MD 20748
|
1,566 sq. feet
|
2 baths 3 beds |
$300,000
|
show details |

|
#33
Mandan Rd Apt 103 Unit 621
Greenbelt, MD 20770
|
1,420 sq. feet
|
2 baths 3 beds |
$179,900
|
show details |

|
#34
Fitzgibbon Ct
Bowie, MD 20721
|
1,300 sq. feet
|
2 baths 3 beds |
$369,200
|
show details |

|
#35
17th St NW Apt 504
Washington, DC 20009
|
800 sq. feet
|
1 baths 1 beds |
$405,000
|
show details |

|
#36
Addison Rd
Capitol Heights, MD 20743
|
1,400 sq. feet
|
1 baths 3 beds |
$260,000
|
show details |

|
#37
Gladys Retreat Cir
Bowie, MD 20720
|
2,880 sq. feet
|
3 baths 3 beds |
$409,900
|
show details |

|
#38
Applegarth Pl
Capitol Heights, MD 20743
|
1,200 sq. feet
|
1 baths 3 beds |
$314,900
|
show details |

|
#39
Pickett Dr
Suitland, MD 20746
|
1,296 sq. feet
|
1 baths 2 beds |
$335,000
|
show details |

|
#40
19th St NW
Washington, DC 20036
|
2,515 sq. feet
|
6 baths 8 beds |
$1,684,800
|
show details |
| Photo | Address | Area | Beds / Baths | Price | Details |
|---|---|---|---|---|---|

|
#41
Monroe St NW
Washington, DC 20010
|
- sq. feet
|
2 baths 2 beds |
$665,000
|
show details |

|
#42
Heming Ln
Bowie, MD 20716
|
1,800 sq. feet
|
2 baths 3 beds |
$400,000
|
show details |

|
#43
Ensleigh Ln
Bowie, MD 20716
|
1,656 sq. feet
|
2 baths 3 beds |
$374,900
|
show details |

|
#44
Cathedral Ave NW Apt 108
Washington, DC 20016
|
765 sq. feet
|
1 baths 1 beds |
$269,900
|
show details |

|
#45
Hammersmith Cir
Silver Spring, MD 20906
|
1,152 sq. feet
|
1 baths 3 beds |
$353,600
|
show details |

|
#46
Eastern Ave NE
Washington, DC 20011
|
1,024 sq. feet
|
1 baths 3 beds |
$395,000
|
show details |

|
#47
Elkhorn Ln
Bowie, MD 20716
|
1,514 sq. feet
|
2 baths 3 beds |
$415,000
|
show details |

|
#48
Pooks Hill Rd Apt 1612s
Bethesda, MD 20814
|
1,250 sq. feet
|
1 baths 2 beds |
$289,000
|
show details |

|
#49
9th St NW
Washington, DC 20011
|
1,604 sq. feet
|
2 baths 3 beds |
$598,000
|
show details |

|
Check over 1 million property listings on Foreclosure.com!
|
browse all offers | |||

Latest news about housing in Beltsville, MD collected exclusively by city-data.com from local newspapers, TV, and radio stations


Median year apartment built: 1983
Household type by relationship:
Households: 19,493- Male householders: 2,500 (476 living alone), Female householders: 3,709 (1,457 living alone)
2,846 spouses (2,846 opposite-sex spouses), 510 unmarried partners, (510 opposite-sex unmarried partners), 5,941 children (5,668 natural, 197 adopted, 75 stepchildren), 653 grandchildren, 449 brothers or sisters, 774 parents, 0 foster children, 1,179 other relatives, 598 non-relatives
- In group quarters: 329
Size of family households: 1,438 2-persons, 826 3-persons, 714 4-persons, 628 5-persons, 135 6-persons, 446 7-or-more-persons.
Size of nonfamily households: 1,903 1-person, 223 2-persons, 32 3-persons, 40 4-persons.
3,020 married couples with children.
957 single-parent households (309 men, 648 women).
45.9% of residents of Beltsville speak English at home.
38.5% of residents speak Spanish at home (47% speak English very well, 26% speak English well, 18% speak English not well, 9% don't speak English at all).
6.4% of residents speak other Indo-European language at home (69% speak English very well, 19% speak English well, 6% speak English not well, 6% don't speak English at all).
4.3% of residents speak Asian or Pacific Island language at home (54% speak English very well, 33% speak English well, 8% speak English not well, 5% don't speak English at all).
8.2% of residents speak other language at home (88% speak English very well, 12% speak English well).
Foreign born population: 8,619 (44.2%)
(49.8% of them are naturalized citizens)
| Here: | 6.9 |
| State: | 7.3 |
| Here: | 4.1 |
| State: | 4.2 |

- Bedrooms in owner-occupied houses and condos in Beltsville, Maryland
- 30no bedroom
- 2021 bedroom
- 5542 bedrooms
- 1,1413 bedrooms
- 9464 bedrooms
- 7915+ bedrooms

- Bedrooms in renter-occupied apartments in Beltsville, Maryland
- 192no bedroom
- 6081 bedroom
- 1,3862 bedrooms
- 2613 bedrooms
- 2114 bedrooms
- 705+ bedrooms

- Cars and other vehicles available in Beltsville in owner-occupied houses/condos
- 184no vehicle
- 7561 vehicle
- 1,4682 vehicles
- 8093 vehicles
- 3694 vehicles
- 765+ vehicles

- Cars and other vehicles available in Beltsville in renter-occupied apartments
- 613no vehicle
- 1,0951 vehicle
- 6092 vehicles
- 2633 vehicles
- 1404 vehicles
- 75+ vehicles

- Rooms in owner-occupied houses in Beltsville, Maryland
- 301 room
- 322 rooms
- 1233 rooms
- 2534 rooms
- 3455 rooms
- 6376 rooms
- 6787 rooms
- 6048 rooms
- 9619+ rooms

- Rooms in renter-occupied apartments in Beltsville, Maryland
- 1921 room
- 952 rooms
- 4083 rooms
- 1,1844 rooms
- 4035 rooms
- 1066 rooms
- 817 rooms
- 1048 rooms
- 1549+ rooms


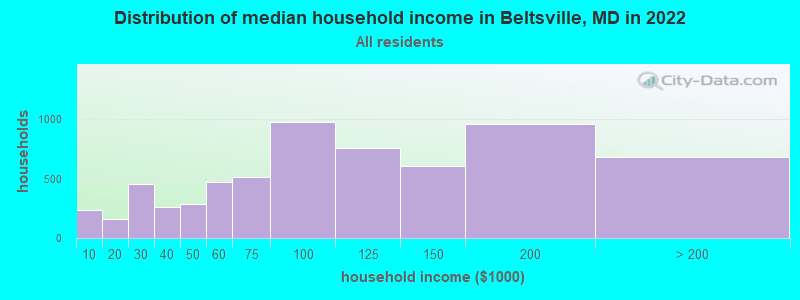
Beltsville, MD household income distribution

- 233Less than $10,000
- 156$10,000 to $19,999
- 458$20,000 to $29,999
- 259$30,000 to $39,999
- 288$40,000 to $49,999
- 469$50,000 to $59,999
- 512$60,000 to $74,999
- 976$75,000 to $99,999
- 761$100,000 to $124,999
- 605$125,000 to $149,999
- 962$150,000 to $199,999
- 678$200,000 or more
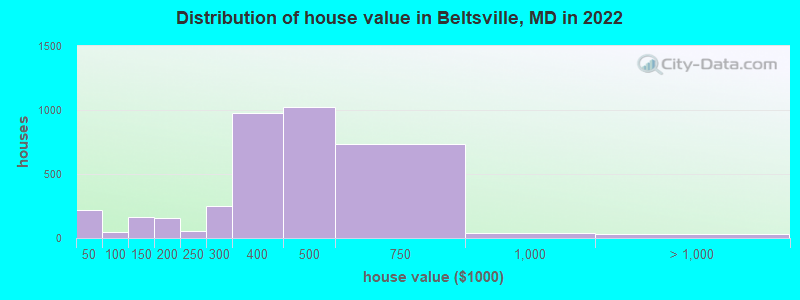
Home value of owner - occupied houses in 2022 in Beltsville, MD
-
- 208Less than $10,000
- 11$10,000 to $14,999
- 4$50,000 to $59,999
- 5$60,000 to $69,999
- 28$80,000 to $89,999
- 11$90,000 to $99,999
- 26$100,000 to $124,999
- 134$125,000 to $149,999
- 83$150,000 to $174,999
- 69$175,000 to $199,999
- 52$200,000 to $249,999
- 248$250,000 to $299,999
- 973$300,000 to $399,999
- 1,022$400,000 to $499,999
- 730$500,000 to $749,999
- 37$750,000 to $999,999
- 30$1,000,000 to $1,499,999
Rent paid by renters in 2022 in Beltsville, MD
-
- 8$550 to $599
- 27$650 to $699
- 4$750 to $799
- 7$900 to $999
- 192$1,000 to $1,249
- 214$1,250 to $1,499
- 822$1,500 to $1,999
- 396$2,000 to $2,499
- 129$2,500 to $2,999
- 431$3,000 to $3,499
- 242$3,500 or more
- 67No cash rent


Percentage of workers working in this county: 46.2%
Number of people working at home: 980 (11.3% of all workers)
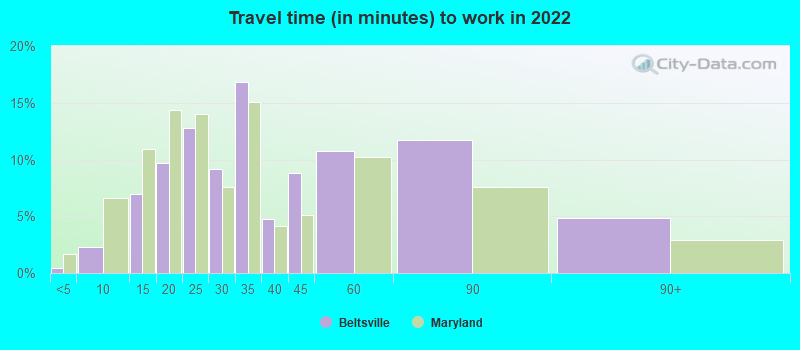
Travel time to work (commute)
- Less than 5 minutes: 118
- 5 to 9 minutes: 264
- 10 to 14 minutes: 755
- 15 to 19 minutes: 634
- 20 to 24 minutes: 821
- 25 to 29 minutes: 527
- 30 to 34 minutes: 1,631
- 35 to 39 minutes: 310
- 40 to 44 minutes: 674
- 45 to 59 minutes: 1,109
- 60 to 89 minutes: 530
- 90 or more minutes: 210
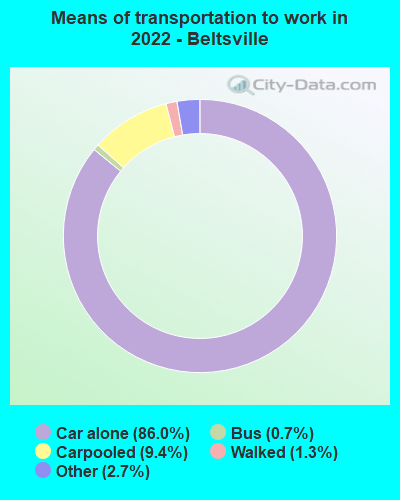
Means of transportation to work:
- Drove a car alone: 14,117 (78.2%)
- Carpooled: 1,394 (7.7%)
- Bus: 78 (0.4%)
- Taxi: 564 (3.1%)
- Bicycle: 7 (0.0%)
- Walked: 207 (1.1%)
- Worked at home: 980 (5.4%)

- Unemployment by race in 2022
- Unemployment rate for White non-Hispanic residents
- 1.4%Males
- 5.7%Females
- Unemployment rate for Black residents
- 10.5%Males
- 7.5%Females
- Unemployment rate for Asian residents
- 11.2%Females
- Unemployment rate for other race residents
- 3.4%Males
- 1.9%Females
- Unemployment rate for two or more race residents
- 6.2%Males
- 14.4%Females
- Unemployment rate for Hispanic or Latino residents
- 3.5%Males
- 4.1%Females

- Year of entry for the foreign-born population in Beltsville, Maryland
- 2,4362010 or later
- 2,5282000 to 2009
- 1,8631990 to 1999
- 1,5531980 to 1989
- 5481970 to 1979
- 280Before 1970

First ancestries reported:
- African: 482 (3.5%)
- Haitian: 370 (2.7%)
- Irish: 314 (2.3%)
- Nigerian: 296 (2.2%)
- German: 292 (2.1%)
- American: 262 (1.9%)
- Ethiopian: 262 (1.9%)
- English: 243 (1.8%)
- Ghanaian: 182 (1.3%)
- Jamaican: 146 (1.1%)
- Italian: 135 (1.0%)
- Trinidadian and Tobagonian: 99 (0.7%)
- European: 84 (0.6%)
- Polish: 70 (0.5%)
- Guyanese: 70 (0.5%)
- Brazilian: 65 (0.5%)
- Scottish: 59 (0.4%)
- Russian: 53 (0.4%)
- Sierra Leonean: 53 (0.4%)
- British West Indian: 49 (0.4%)
- Danish: 34 (0.2%)
- Eastern European: 33 (0.2%)
- Canadian: 32 (0.2%)
- Swedish: 32 (0.2%)
- Armenian: 29 (0.2%)
- Slovak: 27 (0.2%)
- Bulgarian: 25 (0.2%)
- Finnish: 23 (0.2%)
- Ugandan: 20 (0.1%)
- Austrian: 19 (0.1%)
- Jordanian: 16 (0.1%)
- Latvian: 15 (0.1%)
- Slovene: 15 (0.1%)
- Egyptian: 14 (0.1%)
- Norwegian: 14 (0.1%)
- Liberian: 14 (0.1%)
- Pennsylvania German: 11 (0.08%)
- Lithuanian: 11 (0.08%)
- Scotch-Irish: 11 (0.08%)
- Ukrainian: 10 (0.07%)
- West Indian: 10 (0.07%)
- Belgian: 8 (0.06%)
- Welsh: 4 (0.03%)
- Dutch: 3 (0.02%)
- British: 1 (0.01%)
Most common places of birth for foreign-born residents (%):
| Beltsville: | 25.1% (2,130) |
| Maryland: | 12.0% (115,412) |
| Beltsville: | 9.6% (814) |
| Maryland: | 4.4% (42,350) |
| Beltsville: | 5.7% (488) |
| Maryland: | 2.5% (24,026) |
| Beltsville: | 4.7% (397) |
| Maryland: | 1.1% (10,233) |
| Beltsville: | 3.9% (331) |
| Maryland: | 4.6% (44,825) |
| Beltsville: | 3.3% (281) |
| Maryland: | 3.5% (34,065) |
| Beltsville: | 3.0% (252) |
| Maryland: | 3.2% (30,870) |
| Beltsville: | 2.9% (247) |
| Maryland: | 1.4% (13,947) |
| Beltsville: | 2.9% (246) |
| Maryland: | 0.9% (9,100) |
| Beltsville: | 2.9% (244) |
| Maryland: | 2.5% (23,969) |
| Beltsville: | 2.8% (234) |
| Maryland: | 3.8% (36,698) |
| Beltsville: | 2.5% (214) |
| Maryland: | 2.8% (27,444) |
| Beltsville: | 2.5% (209) |
| Maryland: | 6.4% (61,725) |
| Beltsville: | 2.2% (189) |
| Maryland: | 0.6% (5,899) |
| Beltsville: | 1.9% (160) |
| Maryland: | 1.8% (17,774) |
| Beltsville: | 1.6% (140) |
| Maryland: | 4.6% (44,742) |
| Beltsville: | 1.6% (140) |
| Maryland: | 0.7% (7,124) |
Place of birth for U.S.-born residents:
- This state: 5,742
- Other state: 5,268
- Northeast: 1,406
- Midwest: 525
- South: 3,018
- West: 455
91.0% of Beltsville residents lived in the same house 1 years ago.
Out of people who lived in different houses, 30.3% lived in this county.
Out of people who lived in different counties, 73.4% lived in Maryland.
| Beltsville: | 91.0% |
| State average: | 88.5% |
Education attainment for males 25 years and older:
- No schooling: 314
- Nursery to 4th grade: 118
- 5th and 6th grade: 201
- 7th and 8th grade: 251
- 9th grade: 44
- 10th grade: 24
- 11th grade: 141
- 12th grade, no diploma: 198
- High school graduate (or equivalency): 1,328
- Less than 1 year of college: 399
- Some college more than 1 year, no degree: 552
- Associate degree: 358
- Bachelor's degree: 1,127
- Master's degree: 389
- Professional school degree: 167
- Doctorate degree: 119

Education attainment for females 25 years and older:
- No schooling: 210
- Nursery to 4th grade: 175
- 5th and 6th grade: 101
- 7th and 8th grade: 40
- 9th grade: 202
- 10th grade: 12
- 11th grade: 183
- 12th grade, no diploma: 144
- High school graduate (or equivalency): 1,650
- Less than 1 year of college: 313
- Some college more than 1 year, no degree: 830
- Associate degree: 532
- Bachelor's degree: 1,253
- Master's degree: 1,075
- Professional school degree: 104
- Doctorate degree: 192


Housing units in structures:
- One, detached: 3,140
- One, attached: 319
- Two: 25
- 3 or 4: 50
- 5 to 9: 369
- 10 to 19: 1,361
- 20 to 49: 144
- 50 or more: 1,406
Housing units lacking complete kitchen facilities in 2022: 3.2%
House/condo owner moved in on average 15 years ago
Renter moved in on average 6 years ago

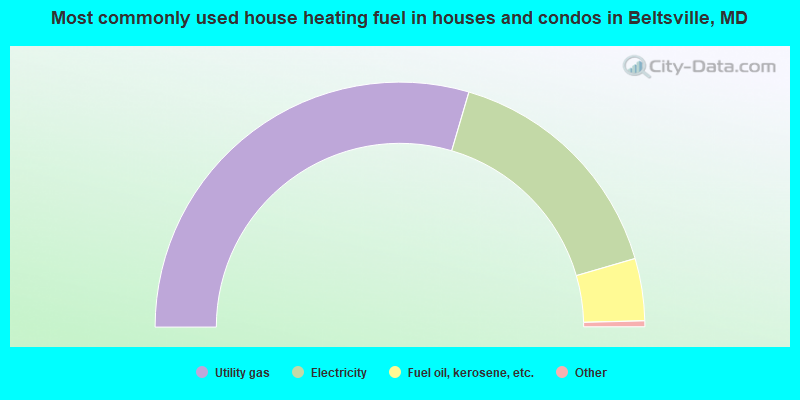
- 59.1%Utility gas
- 31.9%Electricity
- 8.2%Fuel oil, kerosene, etc.
- 0.6%No fuel used
- 0.2%Other fuel
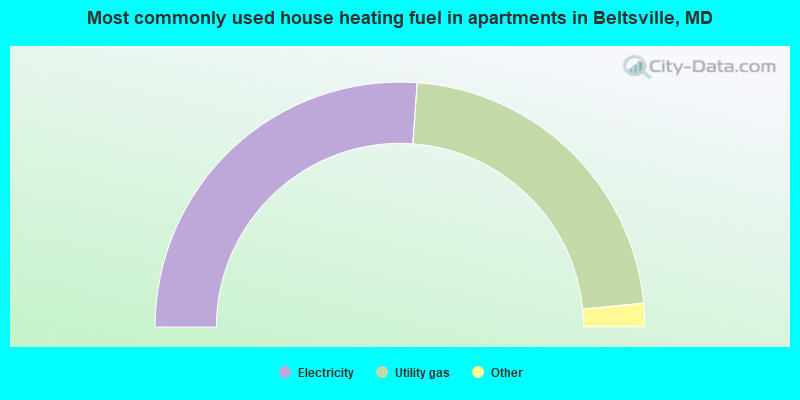
- 52.3%Electricity
- 44.7%Utility gas
- 1.5%No fuel used
- 1.4%Fuel oil, kerosene, etc.
- 0.2%Bottled, tank, or LP gas
Private vs. public school enrollment:
| Here: | 17.7% |
| Maryland: | 15.2% |
| Here: | 3.8% |
| Maryland: | 14.4% |
| Here: | 11.9% |
| Maryland: | 20.2% |


