Bel Air, MD (Maryland) Houses and Residents
Estimated median house or condo value in 2022: $295,545 (it was $121,200 in 2000 )
Bel Air:
$295,545Maryland:
$398,100
Lower value quartile - upper value quartile: $229,605 - $395,016Mean price in 2022: Detached houses: $390,027 Here:
$390,027State:
$526,819
Townhouses or other attached units: $252,022 Here:
$252,022State:
$328,305
In 3-to-4-unit structures: $239,595 Here:
$239,595State:
$295,378
In 5-or-more-unit structures: $208,201 Here:
$208,201State:
$350,378
Total population: 10,264 (Urban population: 9,924, Rural population: 0)
Houses: 5,151 (4,975 occupied: 2,995 owner occupied, 2,031 renter occupied )
% of renters here:
40%State:
32%
Housing density: 1,831 houses/condos per square mile
Median price asked for vacant for-sale houses and condos in 2022 in this county: $260,299.
Median contract rent in 2022: $1,291 (lower quartile is $1,009, upper quartile is $1,476)
Median rent asked for vacant for-rent units in 2022: $3,553
Median gross rent in Bel Air, MD in 2022: $1,452
Housing units in Bel Air with a mortgage: 1,868 (177 second mortgage, 0 home equity loan, 146 both second mortgage and home equity loan )Houses without a mortgage: 69
Median household income for houses/condos with a mortgage: $121,448
Median household income for apartments without a mortgage: $65,307
Median monthly housing costs: $1,311
Data:
Median house or condo value ($)
Median house or condo value ($ change since 2000)
Median house or condo value ($) - White
Median house or condo value ($) - Black or African American
Median house or condo value ($) - Asian
Median house or condo value ($) - Hispanic or Latino
Median house or condo value ($) - American Indian and Alaska Native
Median house or condo value ($) - Multirace
Median house or condo value ($) - Other Race
Median price asked for mobile homes ($)
Household density (households per square mile)
Mean house or condo value by units in structure - 1, detached ($)
Mean house or condo value by units in structure - 1, attached ($)
Mean house or condo value by units in structure - 2 ($)
Mean house or condo value by units in structure by units in structure - 3 or 4 ($)
Mean house or condo value by units in structure - 5 or more ($)
Mean house or condo value by units in structure - Boat, RV, van, etc. ($)
Mean house or condo value by units in structure - Mobile home ($)
Median contract rent ($)
Median contract rent - Lower quartile ($)
Median contract rent - Upper quartile ($)
Median gross rent ($)
Urban houses (%)
Rural houses (%)
Houses occupied (%)
Houses occupied (% change since 2000)
Houses owner occupied (%)
Houses owner occupied (% change since 2000)
Houses renter occupied (%)
Houses renter occupied (% change since 2000)
Vacant housing units - For rent (%)
Vacant housing units - For rent (% change since 2000)
Vacant housing units - For sale only (%)
Vacant housing units - For sale only (% change since 2000)
Vacant housing units - Rented or sold, not occupied (%)
Vacant housing units - Rented or sold, not occupied (% change since 2000)
Vacant housing units - For seasonal, recreational, or occasional use (%)
Vacant housing units - For seasonal, recreational, or occasional use (% change since 2000)
Vacant housing units - For migrant workers (%)
Vacant housing units - For migrant workers (% change since 2000)
Vacant housing units - Other vacant (%)
Vacant housing units - Other vacant (% change since 2000)
Median monthly housing costs ($)
Median household income for houses/condos with a mortgage ($)
Median household income for houses/condos without a mortgage ($)
Median household income ($)
Median household income ($) - White
Median household income ($) - Black or African American
Median household income ($) - Asian
Median household income ($) - Hispanic or Latino
Median household income ($) - American Indian and Alaska Native
Median household income ($) - Multirace
Median household income ($) - Other Race
Mortgage status - with mortgage (%)
Mortgage status - with second mortgage (%)
Mortgage status - with home equity loan (%)
Mortgage status - with both second mortgage and home equity loan (%)
Mortgage status - without a mortgage (%)
Median year house/condo built
Median year apartment built
Household type by relationship - Male householder living alone (%)
Household type by relationship - Male householder not living alone (%)
Household type by relationship - Female householder living alone (%)
Household type by relationship - Female householder not living alone (%)
Household type by relationship - Opposite-Sex spouse (%)
Household type by relationship - Same-Sex spouse (%)
Household type by relationship - Opposite-Sex unmarried partner (%)
Household type by relationship - Same-Sex unmarried partner (%)
Household type by relationship - In group quarters (%)
Size of family households - 2-person household (%)
Size of family households - 3-person household (%)
Size of family households - 4-person household (%)
Size of family households - 5-person household (%)
Size of family households - 6-person household (%)
Size of family households - 7-or-more-person household (%)
Size of nonfamily households - 1-person household (%)
Size of nonfamily households - 2-person household (%)
Size of nonfamily households - 3-person household (%)
Size of nonfamily households - 4-person household (%)
Size of nonfamily households - 5-person household (%)
Size of nonfamily households - 6-person household (%)
Size of nonfamily households - 7-or-moreperson household (%)
Year house built - Built 2010 or later (%)
Year house built - Built 2000 to 2009 (%)
Year house built - Built 1990 to 1999 (%)
Year house built - Built 1980 to 1989 (%)
Year house built - Built 1970 to 1979 (%)
Year house built - Built 1960 to 1969 (%)
Year house built - Built 1950 to 1959 (%)
Year house built - Built 1940 to 1949 (%)
Year house built - Built 1939 or earlier (%)
Median number of rooms in houses and condos
Median number of rooms in apartments
Median number of bedrooms in owner occupied houses
Mean number of bedrooms in owner occupied houses
Median number of bedrooms in renter occupied houses
Mean number of bedrooms in renter occupied houses
Median number of vehichles in owner occupied houses
Mean number of vehichles in owner occupied houses
Median number of vehichles in renter occupied houses
Mean number of vehichles in renter occupied houses
Rooms in owner-occupied houses - 1 room (%)
Rooms in owner-occupied houses - 2 rooms (%)
Rooms in owner-occupied houses - 3 rooms (%)
Rooms in owner-occupied houses - 4 rooms (%)
Rooms in owner-occupied houses - 5 rooms (%)
Rooms in owner-occupied houses - 6 rooms (%)
Rooms in owner-occupied houses - 7 rooms (%)
Rooms in owner-occupied houses - 8 rooms (%)
Rooms in owner-occupied houses - 9+ rooms (%)
Rooms in renter-occupied houses - 1 room (%)
Rooms in renter-occupied houses - 2 rooms (%)
Rooms in renter-occupied houses - 3 rooms (%)
Rooms in renter-occupied houses - 4 rooms (%)
Rooms in renter-occupied houses - 5 rooms (%)
Rooms in renter-occupied houses - 6 rooms (%)
Rooms in renter-occupied houses - 7 rooms (%)
Rooms in renter-occupied houses - 8 rooms (%)
Rooms in renter-occupied houses - 9+ rooms (%)
Bedrooms in owner-occupied houses - no bedrooms (%)
Bedrooms in owner-occupied houses - 1 bedroom (%)
Bedrooms in owner-occupied houses - 2 bedrooms (%)
Bedrooms in owner-occupied houses - 3 bedrooms (%)
Bedrooms in owner-occupied houses - 4 bedrooms (%)
Bedrooms in owner-occupied houses - 5+ bedrooms (%)
Bedrooms in renter-occupied houses - no bedrooms (%)
Bedrooms in renter-occupied houses - 1 bedroom (%)
Bedrooms in renter-occupied houses - 2 bedrooms (%)
Bedrooms in renter-occupied houses - 3 bedrooms (%)
Bedrooms in renter-occupied houses - 4 bedrooms (%)
Bedrooms in renter-occupied houses - 5+ bedrooms (%)
Vehicles available in owner-occupied houses - no vehicle available (%)
Vehicles available in owner-occupied houses - 1 vehicle available(%)
Vehicles available in owner-occupied houses - 2 Vehicles available (%)
Vehicles available in owner-occupied houses - 3 Vehicles available (%)
Vehicles available in owner-occupied houses - 4 Vehicles available (%)
Vehicles available in owner-occupied houses - 5+ Vehicles available (%)
Vehicles available in renter-occupied houses - no vehicle available (%)
Vehicles available in renter-occupied houses - 1 vehicle available (%)
Vehicles available in renter-occupied houses - 2 Vehicles available (%)
Vehicles available in renter-occupied houses - 3 Vehicles available (%)
Vehicles available in renter-occupied houses - 4 Vehicles available (%)
Vehicles available in renter-occupied houses - 5+ Vehicles available (%)
Housing units in structures - 1, detached (%)
Housing units in structures - 1, attached (%)
Housing units in structures - 2 (%)
Housing units in structures - 3 or 4 (%)
Housing units in structures - 5 to 9 (%)
Housing units in structures - 10 to 19 (%)
Housing units in structures - 20 to 49 (%)
Housing units in structures - 50 or more (%)
Housing units in structures - Mobile home (%)
Housing units in structures - Boat, RV, van, etc. (%)
Housing units in structures - Owners - 1, detached (%)
Housing units in structures - Owners - 1, attached (%)
Housing units in structures - Owners - 2 (%)
Housing units in structures - Owners - 3 or 4 (%)
Housing units in structures - Owners - 5 to 9 (%)
Housing units in structures - Owners - 10 to 19 (%)
Housing units in structures - Owners - 20 to 49 (%)
Housing units in structures - Owners - 50 or more (%)
Housing units in structures - Owners - Mobile home (%)
Housing units in structures - Owners - Boat, RV, van, etc. (%)
Housing units in structures - Renters - 1, detached (%)
Housing units in structures - Renters - 1, attached (%)
Housing units in structures - Renters - 2 (%)
Housing units in structures - Renters - 3 or 4 (%)
Housing units in structures - Renters - 5 to 9 (%)
Housing units in structures - Renters - 10 to 19 (%)
Housing units in structures - Renters - 20 to 49 (%)
Housing units in structures - Renters - 50 or more (%)
Housing units in structures - Renters - Mobile home (%)
Housing units in structures - Renters - Boat, RV, van, etc. (%)
House/condo owner moved in on average (years ago)
Renter moved in on average (years ago)
Year householder moved into unit - Moved in 1999 to March 2000 (%)
Year householder moved into unit - Moved in 1999 to March 2000 (%) - White
Year householder moved into unit - Moved in 1999 to March 2000 (%) - Black or African American
Year householder moved into unit - Moved in 1999 to March 2000 (%) - Asian
Year householder moved into unit - Moved in 1999 to March 2000 (%) - Hispanic or Latino
Year householder moved into unit - Moved in 1999 to March 2000 (%) - American Indian and Alaska Native
Year householder moved into unit - Moved in 1999 to March 2000 (%) - Multirace
Year householder moved into unit - Moved in 1999 to March 2000 (%) - Other Race
Year householder moved into unit - Moved in 1995 to 1998 (%)
Year householder moved into unit - Moved in 1995 to 1998 (%) - White
Year householder moved into unit - Moved in 1995 to 1998 (%) - Black or African American
Year householder moved into unit - Moved in 1995 to 1998 (%) - Asian
Year householder moved into unit - Moved in 1995 to 1998 (%) - Hispanic or Latino
Year householder moved into unit - Moved in 1995 to 1998 (%) - American Indian and Alaska Native
Year householder moved into unit - Moved in 1995 to 1998 (%) - Multirace
Year householder moved into unit - Moved in 1995 to 1998 (%) - Other Race
Year householder moved into unit - Moved in 1990 to 1994 (%)
Year householder moved into unit - Moved in 1990 to 1994 (%) - White
Year householder moved into unit - Moved in 1990 to 1994 (%) - Black or African American
Year householder moved into unit - Moved in 1990 to 1994 (%) - Asian
Year householder moved into unit - Moved in 1990 to 1994 (%) - Hispanic or Latino
Year householder moved into unit - Moved in 1990 to 1994 (%) - American Indian and Alaska Native
Year householder moved into unit - Moved in 1990 to 1994 (%) - Multirace
Year householder moved into unit - Moved in 1990 to 1994 (%) - Other Race
Year householder moved into unit - Moved in 1980 to 1989 (%)
Year householder moved into unit - Moved in 1980 to 1989 (%) - White
Year householder moved into unit - Moved in 1980 to 1989 (%) - Black or African American
Year householder moved into unit - Moved in 1980 to 1989 (%) - Asian
Year householder moved into unit - Moved in 1980 to 1989 (%) - Hispanic or Latino
Year householder moved into unit - Moved in 1980 to 1989 (%) - American Indian and Alaska Native
Year householder moved into unit - Moved in 1980 to 1989 (%) - Multirace
Year householder moved into unit - Moved in 1980 to 1989 (%) - Other Race
Year householder moved into unit - Moved in 1970 to 1979 (%)
Year householder moved into unit - Moved in 1970 to 1979 (%) - White
Year householder moved into unit - Moved in 1970 to 1979 (%) - Black or African American
Year householder moved into unit - Moved in 1970 to 1979 (%) - Asian
Year householder moved into unit - Moved in 1970 to 1979 (%) - Hispanic or Latino
Year householder moved into unit - Moved in 1970 to 1979 (%) - American Indian and Alaska Native
Year householder moved into unit - Moved in 1970 to 1979 (%) - Multirace
Year householder moved into unit - Moved in 1970 to 1979 (%) - Other Race
Year householder moved into unit - Moved in 1969 or earlier (%)
Year householder moved into unit - Moved in 1969 or earlier (%) - White
Year householder moved into unit - Moved in 1969 or earlier (%) - Black or African American
Year householder moved into unit - Moved in 1969 or earlier (%) - Asian
Year householder moved into unit - Moved in 1969 or earlier (%) - Hispanic or Latino
Year householder moved into unit - Moved in 1969 or earlier (%) - American Indian and Alaska Native
Year householder moved into unit - Moved in 1969 or earlier (%) - Multirace
Year householder moved into unit - Moved in 1969 or earlier (%) - Other Race
Housing units lacking complete plumbing facilities (%)
Housing units lacking complete kitchen facilities (%)
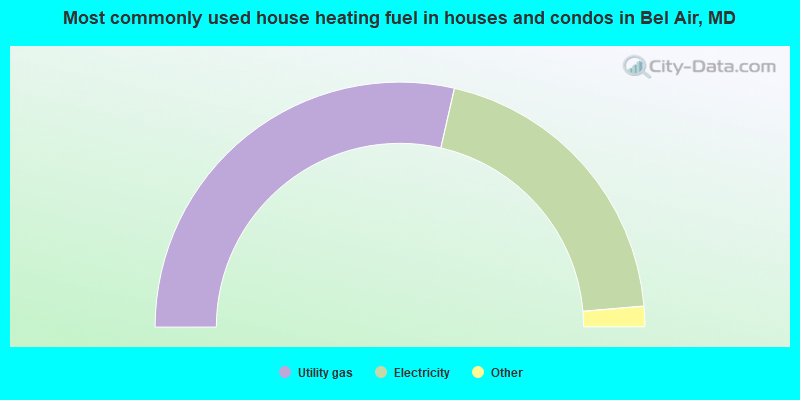
House heating fuel used in houses and condos - Utility gas (%)
House heating fuel used in houses and condos - Bottled, tank, or LP gas (%)
House heating fuel used in houses and condos - Electricity (%)
House heating fuel used in houses and condos - Fuel oil, kerosene, etc. (%)
House heating fuel used in houses and condos - Coal or coke (%)
House heating fuel used in houses and condos - Wood (%)
House heating fuel used in houses and condos - Solar energy (%)
House heating fuel used in houses and condos - Other fuel (%)
House heating fuel used in houses and condos - No fuel used (%)
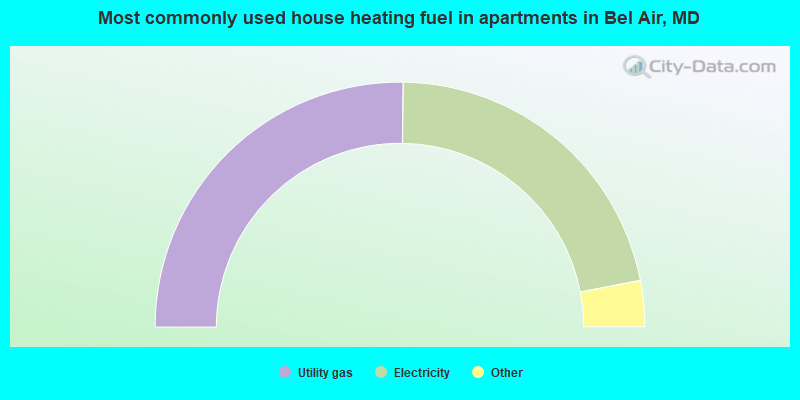
House heating fuel used in apartments - Utility gas (%)
House heating fuel used in apartments - Bottled, tank, or LP gas (%)
House heating fuel used in apartments - Electricity (%)
House heating fuel used in apartments - Fuel oil, kerosene, etc. (%)
House heating fuel used in apartments - Coal or coke (%)
House heating fuel used in apartments - Wood (%)
House heating fuel used in apartments - Solar energy (%)
House heating fuel used in apartments - Other fuel (%)
House heating fuel used in apartments - No fuel used (%)
Median year house/condo built: 1982Median year apartment built: 1974Household type by relationship:
Households: 10,744
Male householders: 2,695 (959 living alone ), Female householders: 2,253 (1,111 living alone )1,904 spouses (1,904 opposite-sex spouses ), 295 unmarried partners , (295 opposite-sex unmarried partners ), 2,557 children (2,464 natural , 27 adopted , 65 stepchildren ), 148 grandchildren , 48 brothers or sisters , 32 parents , 0 foster children , 82 other relatives , 562 non-relatives In group quarters: 162
Size of family households: 963 2-persons , 553 3-persons , 509 4-persons , 144 5-persons , 17 6-persons , 27 7-or-more-persons .
Size of nonfamily households: 2,286 1-person , 559 2-persons , 93 3-persons , 15 4-persons .
1,231 married couples with children. single-parent households (118 men , 285 women ).
88.1% of residents of Bel Air speak English at home. of residents speak Spanish at home (33% speak English very well , 28% speak English well , 39% speak English not well ).of residents speak other Indo-European language at home (35% speak English very well , 32% speak English well , 33% speak English not well ).of residents speak Asian or Pacific Island language at home (38% speak English very well , 23% speak English well , 8% speak English not well , 31% don't speak English at all ).of residents speak other language at home (100% speak English very well ).
Foreign born population: 912 (8.5%)of them are naturalized citizens )
Median number of rooms in houses and condos:
Median number of rooms in apartments
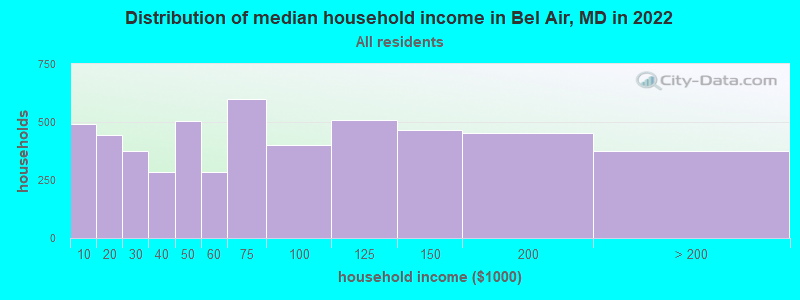
Bel Air, MD household income distribution 490 Less than $10,000444 $10,000 to $19,999374 $20,000 to $29,999286 $30,000 to $39,999505 $40,000 to $49,999283 $50,000 to $59,999600 $60,000 to $74,999399 $75,000 to $99,999510 $100,000 to $124,999466 $125,000 to $149,999454 $150,000 to $199,999377 $200,000 or more
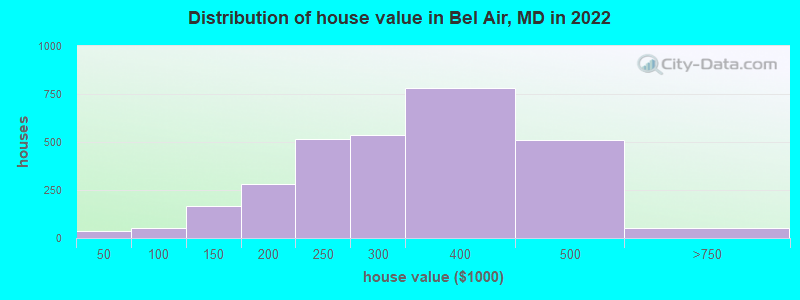
Home value of owner - occupied houses in 2022 in Bel Air, MD 18 Less than $10,0007 $30,000 to $34,9997 $40,000 to $49,99915 $60,000 to $69,99928 $90,000 to $99,99971 $100,000 to $124,99992 $125,000 to $149,999214 $150,000 to $174,99967 $175,000 to $199,999517 $200,000 to $249,999533 $250,000 to $299,999778 $300,000 to $399,999510 $400,000 to $499,99942 $500,000 to $749,9998 $750,000 to $999,999Rent paid by renters in 2022 in Bel Air, MD 3 $100 to $14915 $150 to $19925 $200 to $2498 $300 to $34937 $450 to $49941 $550 to $599104 $800 to $899126 $900 to $999567 $1,000 to $1,249670 $1,250 to $1,499256 $1,500 to $1,99971 $2,000 to $2,49929 $3,500 or more79 No cash rent
Percentage of workers working in this county: 71.5%Number of people working at home: 478 (8.9% of all workers )
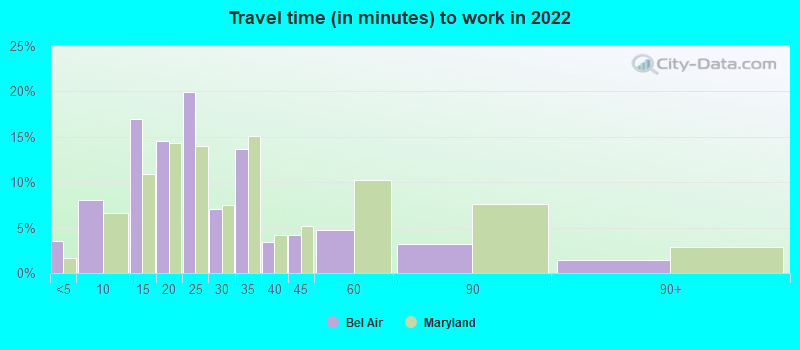
Travel time to work (commute)
Less than 5 minutes: 2025 to 9 minutes: 53910 to 14 minutes: 70615 to 19 minutes: 46620 to 24 minutes: 37225 to 29 minutes: 22130 to 34 minutes: 77935 to 39 minutes: 17940 to 44 minutes: 34545 to 59 minutes: 54260 to 89 minutes: 35290 or more minutes: 59
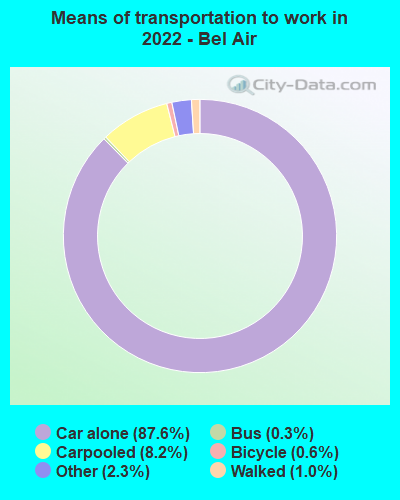
Means of transportation to work:
Drove a car alone: 14,143 (81.1%)Carpooled: 1,402 (8.0%)Bus : 43 (0.2%)Long-distance train or commuter rail : 5 (0.0%)Taxi: 415 (2.4%)Bicycle: 103 (0.6%)Walked: 154 (0.9%)Worked at home: 474 (2.7%)
Unemployment by race in 2022
Unemployment rate for White non-Hispanic residents 3.7% Males4.8% FemalesUnemployment rate for Black residents 46.5% MalesUnemployment rate for two or more race residents 50.6% Females
Year of entry for the foreign-born population in Bel Air, Maryland
227 2010 or later 340 2000 to 2009 29 1990 to 1999 66 1980 to 1989 40 1970 to 1979 123 Before 1970
First ancestries reported:
German: 592 (12.5%)
English: 351 (7.4%)
Irish: 335 (7.0%)
Italian: 267 (5.6%)
American: 191 (4.0%)
Polish: 153 (3.2%)
European: 147 (3.1%)
African: 129 (2.7%)
Greek: 124 (2.6%)
Ukrainian: 55 (1.2%)
Scotch-Irish: 47 (1.0%)
Scottish: 43 (0.9%)
Russian: 32 (0.7%)
Iranian: 26 (0.5%)
Dutch: 17 (0.4%)
Slavic: 17 (0.4%)
Norwegian: 16 (0.3%)
Welsh: 13 (0.3%)
French: 12 (0.3%)
British: 9 (0.2%)
Finnish: 9 (0.2%)
Slovak: 4 (0.08%) Most common places of birth for foreign-born residents (%): China, excluding Hong Kong and Taiwan Bel Air:
18.6% (151)Maryland:
4.6% (44,742)
Indonesia Bel Air:
17.3% (140)Maryland:
0.3% (2,631)
El Salvador Bel Air:
17.3% (140)Maryland:
12.0% (115,412)
Mexico Bel Air:
11.7% (95)Maryland:
3.5% (34,065)
Taiwan Bel Air:
5.6% (45)Maryland:
0.9% (8,520)
Poland Bel Air:
4.6% (37)Maryland:
0.4% (3,418)
Korea Bel Air:
4.4% (36)Maryland:
3.4% (32,635)
Vietnam Bel Air:
4.2% (34)Maryland:
1.9% (18,716)
Panama Bel Air:
3.1% (25)Maryland:
0.3% (2,848)
Ukraine Bel Air:
3.0% (24)Maryland:
0.7% (6,326)
Saudi Arabia Bel Air:
2.5% (20)Maryland:
0.1% (1,053)
Ecuador Bel Air:
2.2% (18)Maryland:
0.6% (6,211)
India Bel Air:
1.9% (15)Maryland:
6.4% (61,725)
Spain Bel Air:
1.7% (14)Maryland:
0.3% (2,547)
Place of birth for U.S.-born residents:
This state: 6,384Other state: 3,052Northeast: 1,058Midwest: 634South: 869West: 496 90.3% of Bel Air residents lived in the same house 1 years ago.
Out of people who lived in different houses, 42.5% lived in this county.
Out of people who lived in different counties, 45.8% lived in Maryland.
Bel Air:
90.3%State average:
88.5%
Education attainment for males 25 years and older:
No schooling: 49Nursery to 4th grade: 05th and 6th grade: 147th and 8th grade: 779th grade: 1610th grade: 911th grade: 1612th grade, no diploma: 112High school graduate (or equivalency): 1,137Less than 1 year of college: 351Some college more than 1 year, no degree: 316Associate degree: 387Bachelor's degree: 865Master's degree: 533Professional school degree: 7Doctorate degree: 83
Education attainment for females 25 years and older:
No schooling: 75Nursery to 4th grade: 05th and 6th grade: 97th and 8th grade: 509th grade: 1510th grade: 2111th grade: 7612th grade, no diploma: 24High school graduate (or equivalency): 1,038Less than 1 year of college: 267Some college more than 1 year, no degree: 310Associate degree: 471Bachelor's degree: 1,060Master's degree: 486Professional school degree: 12Doctorate degree: 65
Housing units in structures:
One, detached: 1,836One, attached: 1,027Two: 993 or 4: 1915 to 9: 51910 to 19: 1,13920 to 49: 19650 or more: 142Housing units lacking complete plumbing facilities in 2022: 1.1%Housing units lacking complete kitchen facilities in 2022: 2.9%House/condo owner moved in on average 10 years ago
Renter moved in on average 2 years ago
Private vs. public school enrollment:
Students in private schools in grades 1 to 8 (elementary and middle school): 22 Students in private schools in grades 9 to 12 (high school): 144 Students in private undergraduate colleges: 10