Bedford, VA (Virginia) Houses and Residents
| Bedford: | $211,307 |
| Virginia: | $365,700 |
Mean price in 2022:
Detached houses: $269,611
Here: $269,611 State: $472,865 Mobile homes: $148,623
Here: $148,623 State: $100,736
Total population: 6,466 (Urban population: 6,299 (all inside urban clusters), Rural population: 0)
Houses: 3,237 (2,870 occupied: 1,455 owner occupied, 1,405 renter occupied)
| % of renters here: | 49% |
| State: | 33% |
Housing density: 470 houses/condos per square mile
Median price asked for vacant for-sale houses and condos in 2022 in this county: $214,204.
Median contract rent in 2022: $640 (lower quartile is $288, upper quartile is $867)
Median rent asked for vacant for-rent units in 2022: $2,411
Median gross rent in Bedford, VA in 2022: $833
Housing units in Bedford with a mortgage: 885 (75 second mortgage, 0 home equity loan, 75 both second mortgage and home equity loan)
Houses without a mortgage: 11
Median household income for houses/condos with a mortgage: $87,381
Median household income for apartments without a mortgage: $33,905
Median monthly housing costs: $781
Compare current foreclosures in Bedford, VA:
| Photo | Address | Area | Beds / Baths | Price | Details |
|---|---|---|---|---|---|

|
#1
Haven Heights Dr
Bedford, VA 24523
|
1,152 sq. feet
|
1 baths 4 beds |
$260,000
|
show details |

|
#2
Glenwood Dr
Bedford, VA 24523
|
2,109 sq. feet
|
2 baths 2 beds |
show details | |

|
#3
Jeter St
Bedford, VA 24523
|
992 sq. feet
|
1 baths 2 beds |
show details | |

|
#4
Locust Ln
Bedford, VA 24523
|
4,314 sq. feet
|
2 baths 3 beds |
show details | |

|
#5
Mcdaniel Rd
Bedford, VA 24523
|
2,052 sq. feet
|
1 baths - beds |
show details | |

|
#6
Dove Meadows Dr
Bedford, VA 24523
|
1,512 sq. feet
|
2 baths - beds |
show details | |

|
#7
Magnolia Dr
Bedford, VA 24523
|
1,680 sq. feet
|
2 baths - beds |
show details | |

|
#8
Huntington Heights Ct
Bedford, VA 24523
|
1,647 sq. feet
|
2 baths - beds |
show details | |

|
#9
Snead Cir
Bedford, VA 24523
|
1,204 sq. feet
|
2 baths - beds |
show details | |

|
#10
Roundtree Dr
Bedford, VA 24523
|
1,100 sq. feet
|
1 baths - beds |
show details |
| Photo | Address | Area | Beds / Baths | Price | Details |
|---|---|---|---|---|---|

|
#11
Stone Mountain Rd
Bedford, VA 24523
|
1,611 sq. feet
|
1 baths - beds |
show details | |

|
#12
Cypress Pl
Bedford, VA 24523
|
1,511 sq. feet
|
2 baths - beds |
show details | |

|
#13
Bold Branch Rd
Bedford, VA 24523
|
1,752 sq. feet
|
2 baths - beds |
show details | |

|
#14
Mcghee St
Bedford, VA 24523
|
- sq. feet
|
- baths - beds |
show details | |

|
#15
Twin Peaks Dr
Bedford, VA 24523
|
- sq. feet
|
- baths - beds |
show details | |

|
#16
Tommy Ln
Bedford, VA 24523
|
- sq. feet
|
- baths - beds |
show details | |

|
#17
Virginia Byway
Bedford, VA 24523
|
- sq. feet
|
- baths - beds |
show details | |

|
#18
E Federal St
Bedford, VA 24523
|
- sq. feet
|
- baths - beds |
show details | |

|
#19
Peaks St
Bedford, VA 24523
|
- sq. feet
|
- baths - beds |
show details | |

|
#20
E Lynchburg Salem Tpke
Bedford, VA 24523
|
- sq. feet
|
- baths - beds |
show details |
| Photo | Address | Area | Beds / Baths | Price | Details |
|---|---|---|---|---|---|

|
#21
Grand Arbre Dr
Bedford, VA 24523
|
- sq. feet
|
- baths - beds |
show details | |

|
#22
E Lynchburg Salem Tpke
Bedford, VA 24523
|
- sq. feet
|
- baths - beds |
show details | |

|
#23
College St
Bedford, VA 24523
|
- sq. feet
|
- baths - beds |
show details | |

|
#24
Moneta Rd
Bedford, VA 24523
|
- sq. feet
|
- baths - beds |
show details | |

|
#25
Big Island Hwy
Bedford, VA 24523
|
- sq. feet
|
- baths - beds |
show details | |

|
#26
Roundtree Dr
Bedford, VA 24523
|
- sq. feet
|
- baths - beds |
show details | |

|
#27
Dickerson Mill Rd
Bedford, VA 24523
|
- sq. feet
|
- baths - beds |
show details | |

|
#28
Monroe St
Bedford, VA 24523
|
- sq. feet
|
- baths - beds |
show details | |

|
#29
Brunmore Ct
Bedford, VA 24523
|
- sq. feet
|
- baths - beds |
show details | |

|
#30
White Pine Ct
Bedford, VA 24523
|
- sq. feet
|
- baths - beds |
show details |
| Photo | Address | Area | Beds / Baths | Price | Details |
|---|---|---|---|---|---|

|
#31
Silverbush St
Bedford, VA 24523
|
2,430 sq. feet
|
- baths - beds |
show details | |

|
#32
W Lynchburg Salem Tpke
Bedford, VA 24523
|
- sq. feet
|
- baths - beds |
show details | |

|
#33
Stoney Way
Bedford, VA 24523
|
- sq. feet
|
- baths - beds |
show details | |

|
#34
Gander Ln
Bedford, VA 24523
|
- sq. feet
|
- baths - beds |
show details | |

|
#35
Elm St
Bedford, VA 24523
|
- sq. feet
|
- baths - beds |
show details | |

|
#36
Edmund St
Bedford, VA 24523
|
- sq. feet
|
- baths - beds |
show details | |

|
#37
Ridge St
Bedford, VA 24523
|
- sq. feet
|
- baths - beds |
show details | |

|
#38
Wyatts Way
Bedford, VA 24523
|
- sq. feet
|
- baths - beds |
show details | |

|
#39
Roundtree Dr
Bedford, VA 24523
|
- sq. feet
|
- baths - beds |
show details | |

|
#40
Gunstock Creek Rd
Bedford, VA 24523
|
975 sq. feet
|
- baths - beds |
show details |
| Photo | Address | Area | Beds / Baths | Price | Details |
|---|---|---|---|---|---|

|
#41
Big Island Hwy
Bedford, VA 24523
|
- sq. feet
|
- baths - beds |
show details | |

|
#42
E Cook St
Bedford, VA 24523
|
- sq. feet
|
- baths - beds |
show details | |

|
#43
Bell Town Rd
Bedford, VA 24523
|
- sq. feet
|
- baths - beds |
show details | |

|
#44
Smith St
Bedford, VA 24523
|
- sq. feet
|
- baths - beds |
show details | |

|
#45
Shady Knoll Ave # B
Bedford, VA 24523
|
- sq. feet
|
- baths - beds |
show details | |

|
#46
Cassell Ln
Bedford, VA 24523
|
- sq. feet
|
- baths - beds |
show details | |

|
#47
Hill Crest Dr
Bedford, VA 24523
|
- sq. feet
|
- baths - beds |
show details | |

|
#48
W Lynchburg Salem Tpke
Bedford, VA 24523
|
- sq. feet
|
- baths - beds |
show details | |

|
#49
Grove St
Bedford, VA 24523
|
- sq. feet
|
- baths - beds |
show details | |

|
Check over 1 million property listings on Foreclosure.com!
|
browse all offers | |||

Latest news about housing in Bedford, VA collected exclusively by city-data.com from local newspapers, TV, and radio stations

 | Prices for beautiful old country estates low for a reason? (35 replies) |
| Single family homes in Roanoke? (3 replies) |
| Real Estate Taxes in Bedford Va. (3 replies) |
| Rivermont area of Lynchburg real estate (2 replies) |
| RELOCATION ASSISTANCE to perimeter areas outside Roanoke/Bedfor (4 replies) |
| Debating a move to Roanoke metro (Starting a Business) (11 replies) |

Median year apartment built: 1976
Household type by relationship:
Households: 6,766- Male householders: 1,122 (288 living alone), Female householders: 1,774 (909 living alone)
1,050 spouses (1,050 opposite-sex spouses), 196 unmarried partners, (196 opposite-sex unmarried partners), 1,910 children (1,458 natural, 37 adopted, 414 stepchildren), 41 grandchildren, 123 brothers or sisters, 76 parents, 34 foster children, 103 other relatives, 12 non-relatives
- In group quarters: 321
Size of family households: 735 2-persons, 350 3-persons, 238 4-persons, 72 5-persons, 18 6-persons, 97 7-or-more-persons.
Size of nonfamily households: 1,268 1-person, 138 2-persons.
898 married couples with children.
381 single-parent households (59 men, 322 women).
93.5% of residents of Bedford speak English at home.
2.8% of residents speak Spanish at home (48% speak English very well, 38% speak English well, 14% speak English not well).
0.5% of residents speak other Indo-European language at home (100% speak English very well).
2.5% of residents speak Asian or Pacific Island language at home (7% speak English very well, 23% speak English well, 46% speak English not well, 23% don't speak English at all).
Foreign born population: 383 (5.7%)
(24.8% of them are naturalized citizens)
| Here: | 6.7 |
| State: | 7.0 |
| Here: | 3.8 |
| State: | 4.3 |

- Bedrooms in owner-occupied houses and condos in Bedford, Virginia
- 0no bedroom
- 311 bedroom
- 2632 bedrooms
- 7393 bedrooms
- 3794 bedrooms
- 435+ bedrooms

- Bedrooms in renter-occupied apartments in Bedford, Virginia
- 53no bedroom
- 2641 bedroom
- 5682 bedrooms
- 4383 bedrooms
- 334 bedrooms
- 495+ bedrooms

- Cars and other vehicles available in Bedford in owner-occupied houses/condos
- 55no vehicle
- 4641 vehicle
- 4822 vehicles
- 2663 vehicles
- 1254 vehicles
- 625+ vehicles

- Cars and other vehicles available in Bedford in renter-occupied apartments
- 259no vehicle
- 6621 vehicle
- 3422 vehicles
- 1313 vehicles
- 114 vehicles
- 05+ vehicles

- Rooms in owner-occupied houses in Bedford, Virginia
- 01 room
- 02 rooms
- 743 rooms
- 724 rooms
- 1645 rooms
- 4076 rooms
- 3527 rooms
- 1418 rooms
- 2449+ rooms

- Rooms in renter-occupied apartments in Bedford, Virginia
- 531 room
- 1092 rooms
- 1453 rooms
- 4444 rooms
- 4015 rooms
- 576 rooms
- 257 rooms
- 748 rooms
- 969+ rooms


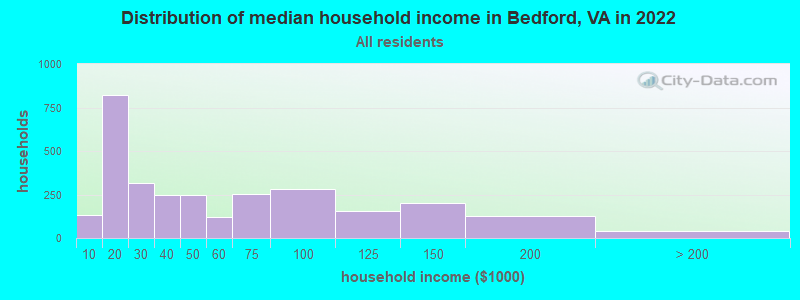
Bedford, VA household income distribution

- 133Less than $10,000
- 820$10,000 to $19,999
- 316$20,000 to $29,999
- 245$30,000 to $39,999
- 246$40,000 to $49,999
- 122$50,000 to $59,999
- 253$60,000 to $74,999
- 279$75,000 to $99,999
- 155$100,000 to $124,999
- 203$125,000 to $149,999
- 129$150,000 to $199,999
- 42$200,000 or more
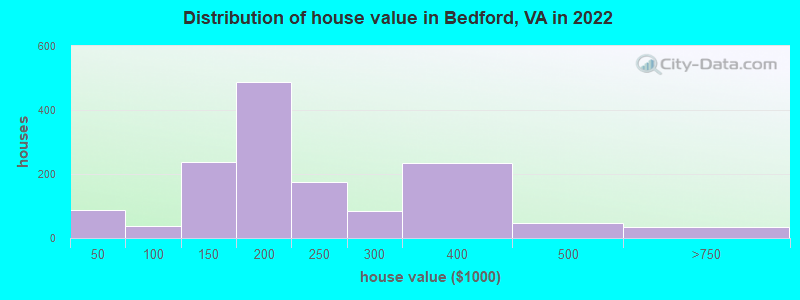
Home value of owner - occupied houses in 2022 in Bedford, VA
-
- 57Less than $10,000
- 19$15,000 to $19,999
- 11$30,000 to $34,999
- 23$60,000 to $69,999
- 13$80,000 to $89,999
- 68$100,000 to $124,999
- 168$125,000 to $149,999
- 194$150,000 to $174,999
- 292$175,000 to $199,999
- 176$200,000 to $249,999
- 83$250,000 to $299,999
- 234$300,000 to $399,999
- 46$400,000 to $499,999
- 32$500,000 to $749,999
Rent paid by renters in 2022 in Bedford, VA
-
- 88Less than $100
- 33$100 to $149
- 113$150 to $199
- 30$200 to $249
- 45$250 to $299
- 28$300 to $349
- 29$350 to $399
- 22$400 to $449
- 73$500 to $549
- 71$550 to $599
- 213$600 to $649
- 112$650 to $699
- 67$700 to $749
- 67$750 to $799
- 155$800 to $899
- 94$900 to $999
- 37$1,000 to $1,249
- 47$1,250 to $1,499
- 4$1,500 to $1,999
- 8$2,000 to $2,499
- 13$2,500 to $2,999
- 34No cash rent


Percentage of workers working in this county: 64.4%
Number of people working at home: 186 (6.2% of all workers)
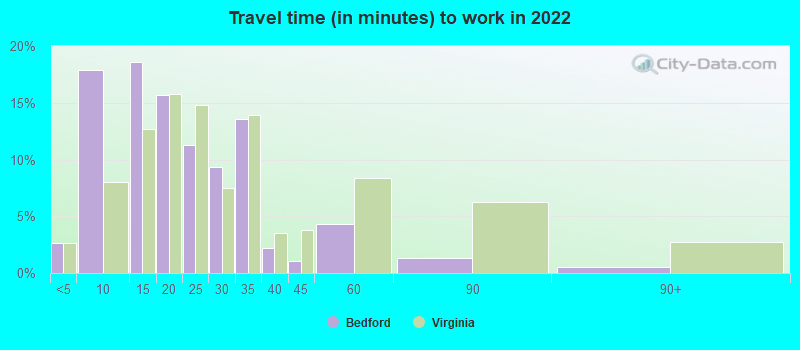
Travel time to work (commute)
- Less than 5 minutes: 157
- 5 to 9 minutes: 362
- 10 to 14 minutes: 275
- 15 to 19 minutes: 168
- 20 to 24 minutes: 206
- 25 to 29 minutes: 118
- 30 to 34 minutes: 508
- 35 to 39 minutes: 142
- 40 to 44 minutes: 200
- 45 to 59 minutes: 277
- 60 to 89 minutes: 30
- 90 or more minutes: 17
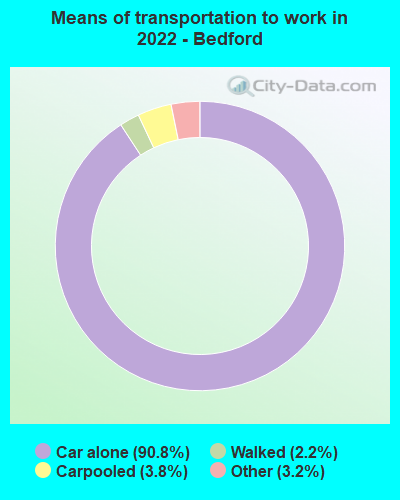
Means of transportation to work:
- Drove a car alone: 4,340 (84.1%)
- Carpooled: 184 (3.6%)
- Taxi: 184 (3.6%)
- Walked: 110 (2.1%)
- Worked at home: 186 (3.6%)

- Unemployment by race in 2022
- Unemployment rate for White non-Hispanic residents
- 6.5%Females
- Unemployment rate for two or more race residents
- 25.9%Males

- Year of entry for the foreign-born population in Bedford, Virginia
- 2222010 or later
- 732000 to 2009
- 241990 to 1999
- 221980 to 1989
- 181970 to 1979
- 35Before 1970

First ancestries reported:
- American: 1,217 (30.0%)
- English: 664 (16.3%)
- German: 189 (4.7%)
- African: 188 (4.6%)
- Italian: 138 (3.4%)
- Irish: 90 (2.2%)
- Scotch-Irish: 86 (2.1%)
- Scottish: 76 (1.9%)
- Welsh: 51 (1.3%)
- Scandinavian: 41 (1.0%)
- French: 28 (0.7%)
- Armenian: 27 (0.7%)
- British: 16 (0.4%)
- Dutch: 16 (0.4%)
- Haitian: 16 (0.4%)
- Jamaican: 14 (0.3%)
- European: 10 (0.2%)
- French Canadian: 10 (0.2%)
- Iranian: 4 (0.10%)
- Greek: 3 (0.07%)
Most common places of birth for foreign-born residents (%):
| Bedford: | 57.7% (203) |
| Virginia: | 0.8% (8,805) |
| Bedford: | 23.6% (83) |
| Virginia: | 2.4% (26,366) |
| Bedford: | 4.5% (16) |
| Virginia: | 0.4% (4,246) |
| Bedford: | 3.7% (13) |
| Virginia: | 1.0% (10,734) |
| Bedford: | 2.8% (10) |
| Virginia: | 4.8% (52,629) |
| Bedford: | 2.8% (10) |
| Virginia: | 1.2% (12,984) |
| Bedford: | 2.3% (8) |
| Virginia: | 0.1% (1,443) |
Place of birth for U.S.-born residents:
- This state: 4,656
- Other state: 1,584
- Northeast: 469
- Midwest: 277
- South: 722
- West: 111
80.4% of Bedford residents lived in the same house 1 years ago.
Out of people who lived in different houses, 37.0% lived in this county.
Out of people who lived in different counties, 91.3% lived in Virginia.
| Bedford: | 80.4% |
| State average: | 86.6% |
Education attainment for males 25 years and older:
- No schooling: 0
- Nursery to 4th grade: 0
- 5th and 6th grade: 16
- 7th and 8th grade: 71
- 9th grade: 77
- 10th grade: 110
- 11th grade: 28
- 12th grade, no diploma: 29
- High school graduate (or equivalency): 859
- Less than 1 year of college: 113
- Some college more than 1 year, no degree: 167
- Associate degree: 64
- Bachelor's degree: 337
- Master's degree: 30
- Professional school degree: 9
- Doctorate degree: 5

Education attainment for females 25 years and older:
- No schooling: 140
- Nursery to 4th grade: 0
- 5th and 6th grade: 2
- 7th and 8th grade: 69
- 9th grade: 18
- 10th grade: 96
- 11th grade: 0
- 12th grade, no diploma: 10
- High school graduate (or equivalency): 851
- Less than 1 year of college: 233
- Some college more than 1 year, no degree: 308
- Associate degree: 271
- Bachelor's degree: 526
- Master's degree: 146
- Professional school degree: 31
- Doctorate degree: 18


Housing units in structures:
- One, detached: 2,037
- One, attached: 174
- Two: 188
- 3 or 4: 39
- 5 to 9: 156
- 10 to 19: 120
- 20 to 49: 168
- 50 or more: 178
- Mobile homes: 172
Median worth of mobile homes: $8,476
Housing units lacking complete kitchen facilities in 2022: 2.7%
House/condo owner moved in on average 9 years ago
Renter moved in on average 2 years ago

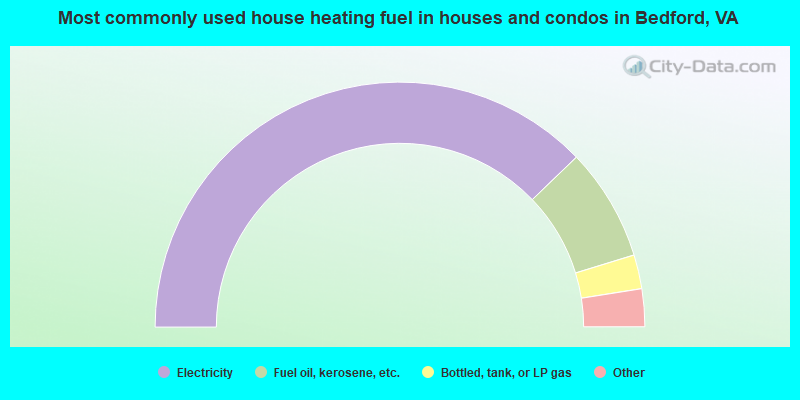
- 75.7%Electricity
- 14.9%Fuel oil, kerosene, etc.
- 4.5%Bottled, tank, or LP gas
- 2.3%No fuel used
- 1.5%Utility gas
- 1.0%Wood
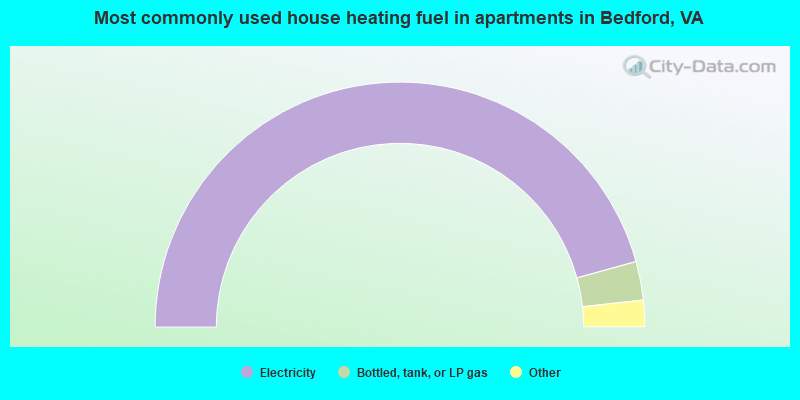
- 91.5%Electricity
- 5.1%Bottled, tank, or LP gas
- 2.1%Fuel oil, kerosene, etc.
- 1.4%No fuel used
Private vs. public school enrollment:
| Here: | 9.4% |
| Virginia: | 13.2% |
| Here: | 32.6% |
| Virginia: | 10.2% |
| Here: | 45.6% |
| Virginia: | 18.7% |


