Bayonne, NJ (New Jersey) Houses and Residents
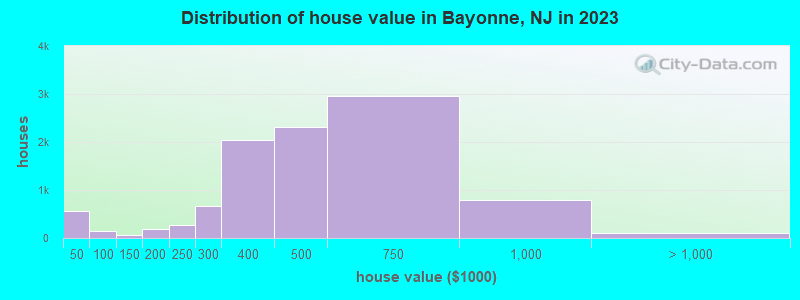
Estimated median house or condo value in 2022: $470,800 (it was $169,400 in 2000 )
Bayonne:
$470,800New Jersey:
$428,900
Lower value quartile - upper value quartile: $349,800 - $628,100Mean price in 2022: Detached houses: $500,500 Here:
$500,500State:
$537,591
Townhouses or other attached units: $357,490 Here:
$357,490State:
$381,113
In 2-unit structures: $472,895 Here:
$472,895State:
$444,476
In 3-to-4-unit structures: $804,242 Here:
$804,242State:
$457,463
In 5-or-more-unit structures: $277,082 Here:
$277,082State:
$368,745
Mobile homes: $184,040 Here:
$184,040State:
$119,788
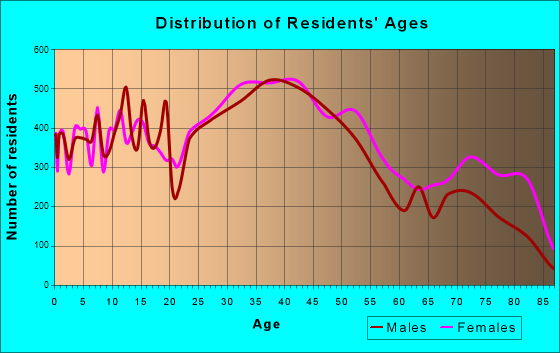
Total population: 65,975 (Urban population: 61,842, Rural population: 0)
Houses: 30,376 (28,393 occupied: 10,663 owner occupied, 17,730 renter occupied )
% of renters here:
62%State:
35%
Housing density: 5,399 houses/condos per square mile
Median price asked for vacant for-sale houses and condos in 2022: $568,902.
Median contract rent in 2022: $1,302 (lower quartile is $1,001, upper quartile is $1,851)
Median rent asked for vacant for-rent units in 2022: $1,334
Median gross rent in Bayonne, NJ in 2022: $1,419
Housing units in Bayonne with a mortgage: 6,962 (579 second mortgage, 0 home equity loan, 537 both second mortgage and home equity loan )Houses without a mortgage: 82
Median household income for houses/condos with a mortgage: $120,931
Median household income for apartments without a mortgage: $89,055
Median monthly housing costs: $1,630
Data:
Median house or condo value ($)
Median house or condo value ($ change since 2000)
Median house or condo value ($) - White
Median house or condo value ($) - Black or African American
Median house or condo value ($) - Asian
Median house or condo value ($) - Hispanic or Latino
Median house or condo value ($) - American Indian and Alaska Native
Median house or condo value ($) - Multirace
Median house or condo value ($) - Other Race
Median price asked for mobile homes ($)
Household density (households per square mile)
Mean house or condo value by units in structure - 1, detached ($)
Mean house or condo value by units in structure - 1, attached ($)
Mean house or condo value by units in structure - 2 ($)
Mean house or condo value by units in structure by units in structure - 3 or 4 ($)
Mean house or condo value by units in structure - 5 or more ($)
Mean house or condo value by units in structure - Boat, RV, van, etc. ($)
Mean house or condo value by units in structure - Mobile home ($)
Median contract rent ($)
Median contract rent - Lower quartile ($)
Median contract rent - Upper quartile ($)
Median gross rent ($)
Urban houses (%)
Rural houses (%)
Houses occupied (%)
Houses occupied (% change since 2000)
Houses owner occupied (%)
Houses owner occupied (% change since 2000)
Houses renter occupied (%)
Houses renter occupied (% change since 2000)
Vacant housing units - For rent (%)
Vacant housing units - For rent (% change since 2000)
Vacant housing units - For sale only (%)
Vacant housing units - For sale only (% change since 2000)
Vacant housing units - Rented or sold, not occupied (%)
Vacant housing units - Rented or sold, not occupied (% change since 2000)
Vacant housing units - For seasonal, recreational, or occasional use (%)
Vacant housing units - For seasonal, recreational, or occasional use (% change since 2000)
Vacant housing units - For migrant workers (%)
Vacant housing units - For migrant workers (% change since 2000)
Vacant housing units - Other vacant (%)
Vacant housing units - Other vacant (% change since 2000)
Median monthly housing costs ($)
Median household income for houses/condos with a mortgage ($)
Median household income for houses/condos without a mortgage ($)
Median household income ($)
Median household income ($) - White
Median household income ($) - Black or African American
Median household income ($) - Asian
Median household income ($) - Hispanic or Latino
Median household income ($) - American Indian and Alaska Native
Median household income ($) - Multirace
Median household income ($) - Other Race
Mortgage status - with mortgage (%)
Mortgage status - with second mortgage (%)
Mortgage status - with home equity loan (%)
Mortgage status - with both second mortgage and home equity loan (%)
Mortgage status - without a mortgage (%)
Median year house/condo built
Median year apartment built
Household type by relationship - Male householder living alone (%)
Household type by relationship - Male householder not living alone (%)
Household type by relationship - Female householder living alone (%)
Household type by relationship - Female householder not living alone (%)
Household type by relationship - Opposite-Sex spouse (%)
Household type by relationship - Same-Sex spouse (%)
Household type by relationship - Opposite-Sex unmarried partner (%)
Household type by relationship - Same-Sex unmarried partner (%)
Household type by relationship - In group quarters (%)
Size of family households - 2-person household (%)
Size of family households - 3-person household (%)
Size of family households - 4-person household (%)
Size of family households - 5-person household (%)
Size of family households - 6-person household (%)
Size of family households - 7-or-more-person household (%)
Size of nonfamily households - 1-person household (%)
Size of nonfamily households - 2-person household (%)
Size of nonfamily households - 3-person household (%)
Size of nonfamily households - 4-person household (%)
Size of nonfamily households - 5-person household (%)
Size of nonfamily households - 6-person household (%)
Size of nonfamily households - 7-or-moreperson household (%)
Year house built - Built 2010 or later (%)
Year house built - Built 2000 to 2009 (%)
Year house built - Built 1990 to 1999 (%)
Year house built - Built 1980 to 1989 (%)
Year house built - Built 1970 to 1979 (%)
Year house built - Built 1960 to 1969 (%)
Year house built - Built 1950 to 1959 (%)
Year house built - Built 1940 to 1949 (%)
Year house built - Built 1939 or earlier (%)
Median number of rooms in houses and condos
Median number of rooms in apartments
Median number of bedrooms in owner occupied houses
Mean number of bedrooms in owner occupied houses
Median number of bedrooms in renter occupied houses
Mean number of bedrooms in renter occupied houses
Median number of vehichles in owner occupied houses
Mean number of vehichles in owner occupied houses
Median number of vehichles in renter occupied houses
Mean number of vehichles in renter occupied houses
Rooms in owner-occupied houses - 1 room (%)
Rooms in owner-occupied houses - 2 rooms (%)
Rooms in owner-occupied houses - 3 rooms (%)
Rooms in owner-occupied houses - 4 rooms (%)
Rooms in owner-occupied houses - 5 rooms (%)
Rooms in owner-occupied houses - 6 rooms (%)
Rooms in owner-occupied houses - 7 rooms (%)
Rooms in owner-occupied houses - 8 rooms (%)
Rooms in owner-occupied houses - 9+ rooms (%)
Rooms in renter-occupied houses - 1 room (%)
Rooms in renter-occupied houses - 2 rooms (%)
Rooms in renter-occupied houses - 3 rooms (%)
Rooms in renter-occupied houses - 4 rooms (%)
Rooms in renter-occupied houses - 5 rooms (%)
Rooms in renter-occupied houses - 6 rooms (%)
Rooms in renter-occupied houses - 7 rooms (%)
Rooms in renter-occupied houses - 8 rooms (%)
Rooms in renter-occupied houses - 9+ rooms (%)
Bedrooms in owner-occupied houses - no bedrooms (%)
Bedrooms in owner-occupied houses - 1 bedroom (%)
Bedrooms in owner-occupied houses - 2 bedrooms (%)
Bedrooms in owner-occupied houses - 3 bedrooms (%)
Bedrooms in owner-occupied houses - 4 bedrooms (%)
Bedrooms in owner-occupied houses - 5+ bedrooms (%)
Bedrooms in renter-occupied houses - no bedrooms (%)
Bedrooms in renter-occupied houses - 1 bedroom (%)
Bedrooms in renter-occupied houses - 2 bedrooms (%)
Bedrooms in renter-occupied houses - 3 bedrooms (%)
Bedrooms in renter-occupied houses - 4 bedrooms (%)
Bedrooms in renter-occupied houses - 5+ bedrooms (%)
Vehicles available in owner-occupied houses - no vehicle available (%)
Vehicles available in owner-occupied houses - 1 vehicle available(%)
Vehicles available in owner-occupied houses - 2 Vehicles available (%)
Vehicles available in owner-occupied houses - 3 Vehicles available (%)
Vehicles available in owner-occupied houses - 4 Vehicles available (%)
Vehicles available in owner-occupied houses - 5+ Vehicles available (%)
Vehicles available in renter-occupied houses - no vehicle available (%)
Vehicles available in renter-occupied houses - 1 vehicle available (%)
Vehicles available in renter-occupied houses - 2 Vehicles available (%)
Vehicles available in renter-occupied houses - 3 Vehicles available (%)
Vehicles available in renter-occupied houses - 4 Vehicles available (%)
Vehicles available in renter-occupied houses - 5+ Vehicles available (%)
Housing units in structures - 1, detached (%)
Housing units in structures - 1, attached (%)
Housing units in structures - 2 (%)
Housing units in structures - 3 or 4 (%)
Housing units in structures - 5 to 9 (%)
Housing units in structures - 10 to 19 (%)
Housing units in structures - 20 to 49 (%)
Housing units in structures - 50 or more (%)
Housing units in structures - Mobile home (%)
Housing units in structures - Boat, RV, van, etc. (%)
Housing units in structures - Owners - 1, detached (%)
Housing units in structures - Owners - 1, attached (%)
Housing units in structures - Owners - 2 (%)
Housing units in structures - Owners - 3 or 4 (%)
Housing units in structures - Owners - 5 to 9 (%)
Housing units in structures - Owners - 10 to 19 (%)
Housing units in structures - Owners - 20 to 49 (%)
Housing units in structures - Owners - 50 or more (%)
Housing units in structures - Owners - Mobile home (%)
Housing units in structures - Owners - Boat, RV, van, etc. (%)
Housing units in structures - Renters - 1, detached (%)
Housing units in structures - Renters - 1, attached (%)
Housing units in structures - Renters - 2 (%)
Housing units in structures - Renters - 3 or 4 (%)
Housing units in structures - Renters - 5 to 9 (%)
Housing units in structures - Renters - 10 to 19 (%)
Housing units in structures - Renters - 20 to 49 (%)
Housing units in structures - Renters - 50 or more (%)
Housing units in structures - Renters - Mobile home (%)
Housing units in structures - Renters - Boat, RV, van, etc. (%)
House/condo owner moved in on average (years ago)
Renter moved in on average (years ago)
Year householder moved into unit - Moved in 1999 to March 2000 (%)
Year householder moved into unit - Moved in 1999 to March 2000 (%) - White
Year householder moved into unit - Moved in 1999 to March 2000 (%) - Black or African American
Year householder moved into unit - Moved in 1999 to March 2000 (%) - Asian
Year householder moved into unit - Moved in 1999 to March 2000 (%) - Hispanic or Latino
Year householder moved into unit - Moved in 1999 to March 2000 (%) - American Indian and Alaska Native
Year householder moved into unit - Moved in 1999 to March 2000 (%) - Multirace
Year householder moved into unit - Moved in 1999 to March 2000 (%) - Other Race
Year householder moved into unit - Moved in 1995 to 1998 (%)
Year householder moved into unit - Moved in 1995 to 1998 (%) - White
Year householder moved into unit - Moved in 1995 to 1998 (%) - Black or African American
Year householder moved into unit - Moved in 1995 to 1998 (%) - Asian
Year householder moved into unit - Moved in 1995 to 1998 (%) - Hispanic or Latino
Year householder moved into unit - Moved in 1995 to 1998 (%) - American Indian and Alaska Native
Year householder moved into unit - Moved in 1995 to 1998 (%) - Multirace
Year householder moved into unit - Moved in 1995 to 1998 (%) - Other Race
Year householder moved into unit - Moved in 1990 to 1994 (%)
Year householder moved into unit - Moved in 1990 to 1994 (%) - White
Year householder moved into unit - Moved in 1990 to 1994 (%) - Black or African American
Year householder moved into unit - Moved in 1990 to 1994 (%) - Asian
Year householder moved into unit - Moved in 1990 to 1994 (%) - Hispanic or Latino
Year householder moved into unit - Moved in 1990 to 1994 (%) - American Indian and Alaska Native
Year householder moved into unit - Moved in 1990 to 1994 (%) - Multirace
Year householder moved into unit - Moved in 1990 to 1994 (%) - Other Race
Year householder moved into unit - Moved in 1980 to 1989 (%)
Year householder moved into unit - Moved in 1980 to 1989 (%) - White
Year householder moved into unit - Moved in 1980 to 1989 (%) - Black or African American
Year householder moved into unit - Moved in 1980 to 1989 (%) - Asian
Year householder moved into unit - Moved in 1980 to 1989 (%) - Hispanic or Latino
Year householder moved into unit - Moved in 1980 to 1989 (%) - American Indian and Alaska Native
Year householder moved into unit - Moved in 1980 to 1989 (%) - Multirace
Year householder moved into unit - Moved in 1980 to 1989 (%) - Other Race
Year householder moved into unit - Moved in 1970 to 1979 (%)
Year householder moved into unit - Moved in 1970 to 1979 (%) - White
Year householder moved into unit - Moved in 1970 to 1979 (%) - Black or African American
Year householder moved into unit - Moved in 1970 to 1979 (%) - Asian
Year householder moved into unit - Moved in 1970 to 1979 (%) - Hispanic or Latino
Year householder moved into unit - Moved in 1970 to 1979 (%) - American Indian and Alaska Native
Year householder moved into unit - Moved in 1970 to 1979 (%) - Multirace
Year householder moved into unit - Moved in 1970 to 1979 (%) - Other Race
Year householder moved into unit - Moved in 1969 or earlier (%)
Year householder moved into unit - Moved in 1969 or earlier (%) - White
Year householder moved into unit - Moved in 1969 or earlier (%) - Black or African American
Year householder moved into unit - Moved in 1969 or earlier (%) - Asian
Year householder moved into unit - Moved in 1969 or earlier (%) - Hispanic or Latino
Year householder moved into unit - Moved in 1969 or earlier (%) - American Indian and Alaska Native
Year householder moved into unit - Moved in 1969 or earlier (%) - Multirace
Year householder moved into unit - Moved in 1969 or earlier (%) - Other Race
Housing units lacking complete plumbing facilities (%)
Housing units lacking complete kitchen facilities (%)
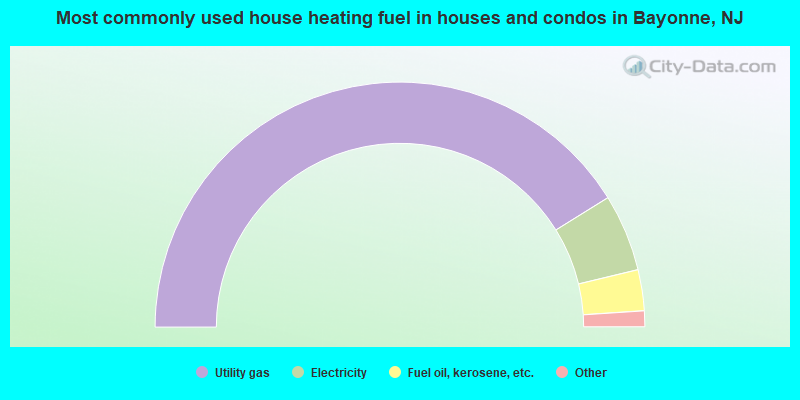
House heating fuel used in houses and condos - Utility gas (%)
House heating fuel used in houses and condos - Bottled, tank, or LP gas (%)
House heating fuel used in houses and condos - Electricity (%)
House heating fuel used in houses and condos - Fuel oil, kerosene, etc. (%)
House heating fuel used in houses and condos - Coal or coke (%)
House heating fuel used in houses and condos - Wood (%)
House heating fuel used in houses and condos - Solar energy (%)
House heating fuel used in houses and condos - Other fuel (%)
House heating fuel used in houses and condos - No fuel used (%)
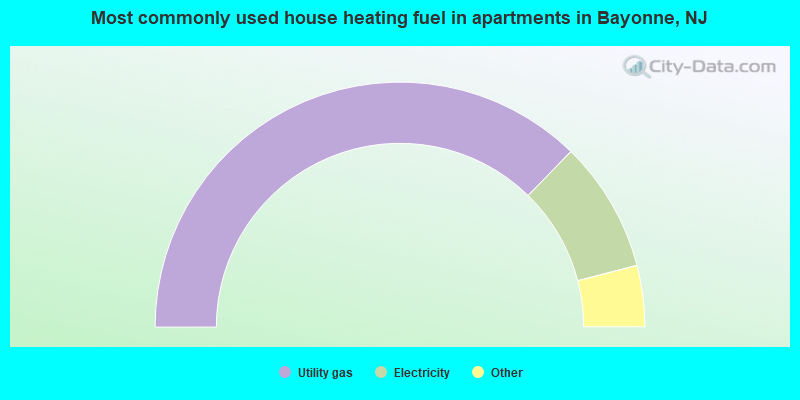
House heating fuel used in apartments - Utility gas (%)
House heating fuel used in apartments - Bottled, tank, or LP gas (%)
House heating fuel used in apartments - Electricity (%)
House heating fuel used in apartments - Fuel oil, kerosene, etc. (%)
House heating fuel used in apartments - Coal or coke (%)
House heating fuel used in apartments - Wood (%)
House heating fuel used in apartments - Solar energy (%)
House heating fuel used in apartments - Other fuel (%)
House heating fuel used in apartments - No fuel used (%)
Latest news about housing in Bayonne, NJ collected exclusively by city-data.com from local newspapers, TV, and radio stations
Median year house/condo built: 1943Median year apartment built: 1955Household type by relationship:
Households: 69,527
Male householders: 13,702 (4,806 living alone ), Female householders: 14,691 (4,887 living alone )9,434 spouses (9,434 opposite-sex spouses ), 3,768 unmarried partners , (3,703 opposite-sex unmarried partners ), 19,222 children (18,201 natural , 39 adopted , 982 stepchildren ), 1,453 grandchildren , 1,808 brothers or sisters , 1,687 parents , 0 foster children , 2,225 other relatives , 1,395 non-relatives In group quarters: 142
Size of family households: 5,829 2-persons , 5,023 3-persons , 2,581 4-persons , 1,896 5-persons , 286 6-persons , 766 7-or-more-persons .
Size of nonfamily households: 9,693 1-person , 2,217 2-persons , 102 3-persons .
8,440 married couples with children. single-parent households (981 men , 3,962 women ).
58.5% of residents of Bayonne speak English at home. of residents speak Spanish at home (62% speak English very well , 18% speak English well , 14% speak English not well , 7% don't speak English at all ).of residents speak other Indo-European language at home (77% speak English very well , 15% speak English well , 4% speak English not well , 4% don't speak English at all ).of residents speak Asian or Pacific Island language at home (70% speak English very well , 26% speak English well , 3% speak English not well , 1% don't speak English at all ).of residents speak other language at home (75% speak English very well , 14% speak English well , 9% speak English not well , 2% don't speak English at all ).
Foreign born population: 17,130 (24.6%)of them are naturalized citizens )
Median number of rooms in houses and condos:
Median number of rooms in apartments
Owner-occupied Renter-occupied
Rooms in owner-occupied houses in Bayonne, New Jersey
0 1 room 41 2 rooms 561 3 rooms 2,379 4 rooms 2,924 5 rooms 2,062 6 rooms 1,077 7 rooms 673 8 rooms 946 9+ rooms
Rooms in renter-occupied apartments in Bayonne, New Jersey
233 1 room 1,290 2 rooms 5,068 3 rooms 5,815 4 rooms 2,674 5 rooms 1,809 6 rooms 500 7 rooms 174 8 rooms 167 9+ rooms
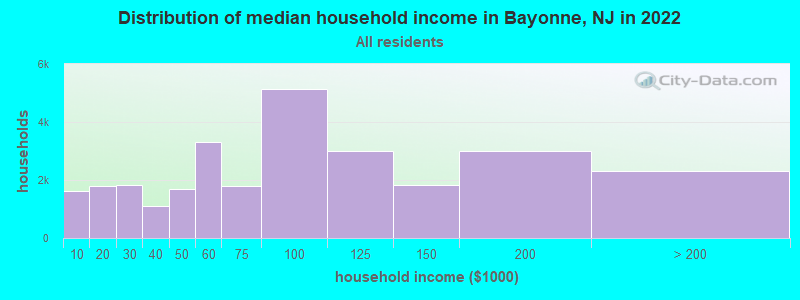
Bayonne, NJ household income distribution 1,632 Less than $10,0001,793 $10,000 to $19,9991,811 $20,000 to $29,9991,113 $30,000 to $39,9991,675 $40,000 to $49,9993,320 $50,000 to $59,9991,783 $60,000 to $74,9995,134 $75,000 to $99,9993,009 $100,000 to $124,9991,815 $125,000 to $149,9992,985 $150,000 to $199,9992,323 $200,000 or more
Home value of owner - occupied houses in 2022 in Bayonne, NJ 432 Less than $10,00015 $10,000 to $14,99932 $25,000 to $29,99940 $35,000 to $39,99933 $40,000 to $49,99986 $50,000 to $59,99918 $80,000 to $89,99923 $90,000 to $99,999141 $100,000 to $124,99937 $125,000 to $149,999266 $150,000 to $174,999134 $175,000 to $199,999480 $200,000 to $249,999496 $250,000 to $299,9992,324 $300,000 to $399,9992,503 $400,000 to $499,9993,166 $500,000 to $749,999573 $750,000 to $999,99987 $1,000,000 to $1,499,99960 $2,000,000 or moreRent paid by renters in 2022 in Bayonne, NJ 45 Less than $10061 $100 to $149351 $150 to $199209 $200 to $249343 $250 to $299155 $300 to $34969 $350 to $399138 $400 to $44944 $450 to $49971 $500 to $54940 $550 to $599244 $600 to $649235 $650 to $699360 $700 to $749212 $750 to $799774 $800 to $899570 $900 to $9993,564 $1,000 to $1,2492,400 $1,250 to $1,4994,055 $1,500 to $1,9992,176 $2,000 to $2,499584 $2,500 to $2,99931 $3,000 to $3,49915 $3,500 or more388 No cash rent
Percentage of workers working in this county: 69.8%Number of people working at home: 4,854 (15.0% of all workers )
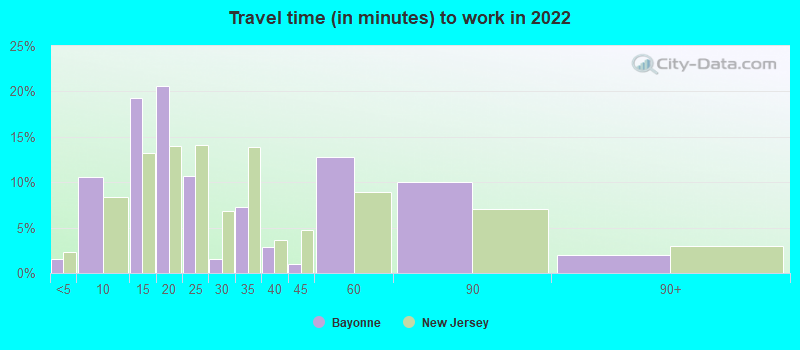
Travel time to work (commute)
Less than 5 minutes: 1655 to 9 minutes: 1,75210 to 14 minutes: 3,61015 to 19 minutes: 3,29820 to 24 minutes: 3,19025 to 29 minutes: 1,58730 to 34 minutes: 3,15635 to 39 minutes: 70640 to 44 minutes: 1,17045 to 59 minutes: 3,85560 to 89 minutes: 2,50690 or more minutes: 2,547
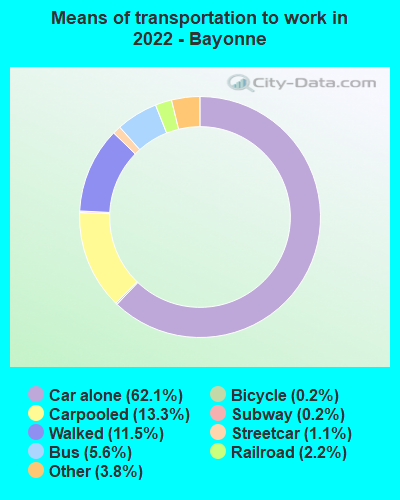
Means of transportation to work:
Drove a car alone: 9,188 (47.3%)Carpooled: 2,067 (10.6%)Bus : 830 (4.3%)Subway or elevated rail : 136 (0.7%)Long-distance train or commuter rail : 19 (0.1%)Light rail, streetcar or trolley : 497 (2.6%)Taxi: 660 (3.4%)Bicycle: 19 (0.1%)Walked: 1,782 (9.2%)Worked at home: 4,580 (23.6%)
Unemployment by race in 2022
Unemployment rate for White non-Hispanic residents 5.2% Males2.0% FemalesUnemployment rate for Black residents 0.9% Males3.5% FemalesUnemployment rate for Asian residents 2.0% Males7.0% FemalesUnemployment rate for other race residents 11.5% Males4.8% FemalesUnemployment rate for two or more race residents 3.6% Males3.4% FemalesUnemployment rate for Hispanic or Latino residents 7.9% Males5.2% Females
Year of entry for the foreign-born population in Bayonne, New Jersey
6,482 2010 or later 5,152 2000 to 2009 4,090 1990 to 1999 3,661 1980 to 1989 1,599 1970 to 1979 1,995 Before 1970
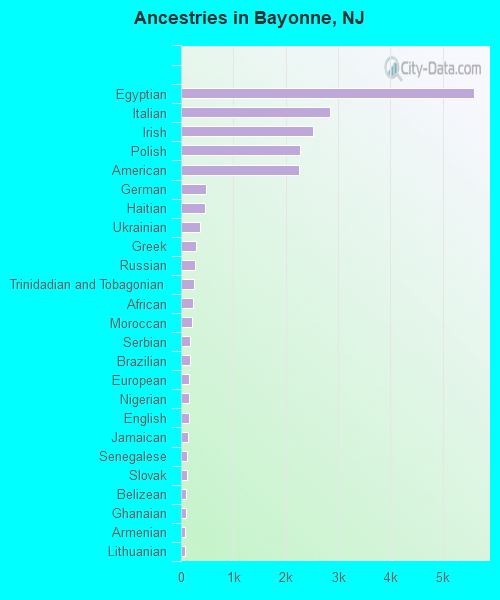
First ancestries reported:
Egyptian: 5,603 (12.4%)
Italian: 2,848 (6.3%)
Irish: 2,530 (5.6%)
Polish: 2,264 (5.0%)
American: 2,256 (5.0%)
German: 476 (1.1%)
Haitian: 457 (1.0%)
Ukrainian: 370 (0.8%)
Greek: 287 (0.6%)
Russian: 267 (0.6%)
Trinidadian and Tobagonian: 241 (0.5%)
African: 228 (0.5%)
Moroccan: 210 (0.5%)
Serbian: 176 (0.4%)
Brazilian: 170 (0.4%)
European: 150 (0.3%)
Nigerian: 148 (0.3%)
English: 148 (0.3%)
Jamaican: 130 (0.3%)
Senegalese: 113 (0.3%)
Slovak: 112 (0.2%)
Belizean: 104 (0.2%)
Ghanaian: 86 (0.2%)
Armenian: 80 (0.2%)
Lithuanian: 75 (0.2%)
Barbadian: 66 (0.1%)
French: 59 (0.1%)
Czech: 59 (0.1%)
Guyanese: 57 (0.1%)
Romanian: 53 (0.1%)
Portuguese: 46 (0.1%)
Eastern European: 42 (0.09%)
Palestinian: 39 (0.09%)
Liberian: 37 (0.08%)
Belgian: 35 (0.08%)
Israeli: 34 (0.08%)
Czechoslovakian: 33 (0.07%)
Turkish: 31 (0.07%)
Scottish: 30 (0.07%)
Croatian: 30 (0.07%)
Maltese: 28 (0.06%)
British West Indian: 26 (0.06%)
Afghan: 25 (0.06%)
Iranian: 25 (0.06%)
Scotch-Irish: 22 (0.05%)
Bermudan: 22 (0.05%)
British: 21 (0.05%)
Canadian: 18 (0.04%)
Arab: 15 (0.03%)
Hungarian: 13 (0.03%)
Swedish: 10 (0.02%)
French Canadian: 7 (0.02%)
Carpatho Rusyn: 6 (0.01%)
West Indian: 6 (0.01%)
Northern European: 3 (0.01%)
Norwegian: 3 (0.01%)
Most common places of birth for foreign-born residents (%): Egypt Bayonne:
17.9% (3,865)New Jersey:
1.6% (33,678)
Dominican Republic Bayonne:
12.0% (2,583)New Jersey:
9.7% (209,055)
Philippines Bayonne:
9.2% (1,986)New Jersey:
4.0% (85,934)
India Bayonne:
6.1% (1,323)New Jersey:
12.8% (274,609)
Colombia Bayonne:
4.6% (986)New Jersey:
4.2% (90,817)
Ecuador Bayonne:
4.2% (907)New Jersey:
4.4% (95,275)
Pakistan Bayonne:
3.5% (761)New Jersey:
1.3% (27,580)
Mexico Bayonne:
3.4% (728)New Jersey:
4.8% (102,527)
Poland Bayonne:
2.4% (523)New Jersey:
2.3% (48,811)
El Salvador Bayonne:
1.9% (418)New Jersey:
2.3% (48,885)
Italy Bayonne:
1.7% (376)New Jersey:
1.5% (33,198)
Bolivia Bayonne:
1.6% (352)New Jersey:
0.2% (3,252)
Ukraine Bayonne:
1.6% (338)New Jersey:
1.1% (22,760)
Haiti Bayonne:
1.5% (330)New Jersey:
2.3% (49,491)
Place of birth for U.S.-born residents:
This state: 33,614Other state: 15,460Northeast: 13,451Midwest: 291South: 1,641West: 77 91.9% of Bayonne residents lived in the same house 1 years ago.
Out of people who lived in different houses, 30.4% lived in this county.
Out of people who lived in different counties, 39.4% lived in New Jersey.
Bayonne:
91.9%State average:
90.4%
Education attainment for males 25 years and older:
No schooling: 632Nursery to 4th grade: 585th and 6th grade: 5737th and 8th grade: 6809th grade: 16510th grade: 19911th grade: 40112th grade, no diploma: 464High school graduate (or equivalency): 6,677Less than 1 year of college: 1,255Some college more than 1 year, no degree: 2,728Associate degree: 1,538Bachelor's degree: 6,842Master's degree: 1,858Professional school degree: 381Doctorate degree: 172
Education attainment for females 25 years and older:
No schooling: 469Nursery to 4th grade: 05th and 6th grade: 3877th and 8th grade: 5009th grade: 40110th grade: 4911th grade: 20512th grade, no diploma: 251High school graduate (or equivalency): 5,487Less than 1 year of college: 938Some college more than 1 year, no degree: 3,394Associate degree: 1,694Bachelor's degree: 7,261Master's degree: 2,724Professional school degree: 271Doctorate degree: 294
Housing units in structures:
One, detached: 4,333One, attached: 1,870Two: 10,4023 or 4: 3,6185 to 9: 2,76710 to 19: 2,66120 to 49: 1,55850 or more: 3,121Mobile homes: 46Housing units lacking complete plumbing facilities in 2022: 1.3%Housing units lacking complete kitchen facilities in 2022: 2.0%House/condo owner moved in on average 17 years ago
Renter moved in on average 4 years ago
Private vs. public school enrollment:
Students in private schools in grades 1 to 8 (elementary and middle school): 660 Here:
9.6%New Jersey:
12.3%
Students in private schools in grades 9 to 12 (high school): 208 Here:
7.3%New Jersey:
13.1%
Students in private undergraduate colleges: 341 Here:
12.4%New Jersey:
33.2%