Baton Rouge, LA (Louisiana) Houses and Residents
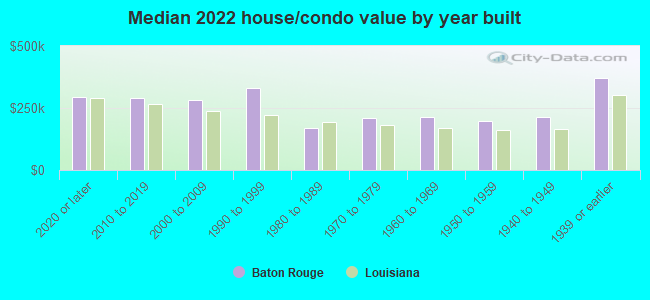
Estimated median house or condo value in 2022: $224,600 (it was $93,100 in 2000 )
Baton Rouge:
$224,600Louisiana:
$209,200
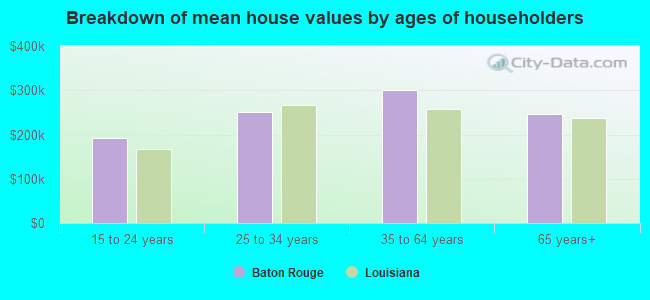
Lower value quartile - upper value quartile: $137,000 - $357,900Mean price in 2022: Detached houses: $319,087 Here:
$319,087State:
$273,555
Townhouses or other attached units: $224,085 Here:
$224,085State:
$297,713
In 2-unit structures: $91,863 Here:
$91,863State:
$325,117
In 3-to-4-unit structures: $223,304 Here:
$223,304State:
$213,088
In 5-or-more-unit structures: $183,549 Here:
$183,549State:
$257,054
Mobile homes: $42,032 Here:
$42,032State:
$89,857
Total population: 228,895 (Urban population: 227,807, Rural population: 113 (22 farm, 91 nonfarm ))
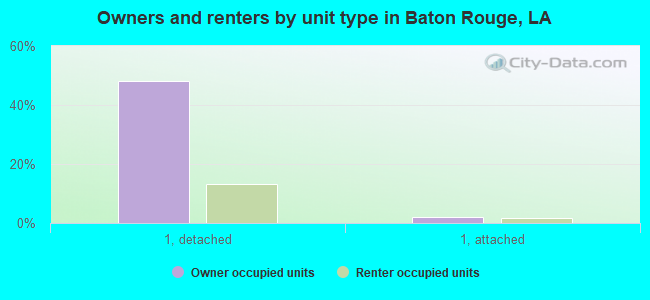
Houses: 106,202 (89,204 occupied: 40,195 owner occupied, 49,009 renter occupied )
% of renters here:
55%State:
32%
Housing density: 1,382 houses/condos per square mile
Median price asked for vacant for-sale houses and condos in 2022: $147,398.
Median contract rent in 2022: $832 (lower quartile is $632, upper quartile is $1,095)
Median rent asked for vacant for-rent units in 2022: $1,087
Median gross rent in Baton Rouge, LA in 2022: $1,005
Housing units in Baton Rouge with a mortgage: 22,625 (1,813 second mortgage, 0 home equity loan, 1,516 both second mortgage and home equity loan )Houses without a mortgage: 570
Median household income for houses/condos with a mortgage: $94,246
Median household income for apartments without a mortgage: $48,107
Median monthly housing costs: $1,026
Data:
Median house or condo value ($)
Median house or condo value ($ change since 2000)
Median house or condo value ($) - White
Median house or condo value ($) - Black or African American
Median house or condo value ($) - Asian
Median house or condo value ($) - Hispanic or Latino
Median house or condo value ($) - American Indian and Alaska Native
Median house or condo value ($) - Multirace
Median house or condo value ($) - Other Race
Median price asked for mobile homes ($)
Household density (households per square mile)
Mean house or condo value by units in structure - 1, detached ($)
Mean house or condo value by units in structure - 1, attached ($)
Mean house or condo value by units in structure - 2 ($)
Mean house or condo value by units in structure by units in structure - 3 or 4 ($)
Mean house or condo value by units in structure - 5 or more ($)
Mean house or condo value by units in structure - Boat, RV, van, etc. ($)
Mean house or condo value by units in structure - Mobile home ($)
Median contract rent ($)
Median contract rent - Lower quartile ($)
Median contract rent - Upper quartile ($)
Median gross rent ($)
Urban houses (%)
Rural houses (%)
Houses occupied (%)
Houses occupied (% change since 2000)
Houses owner occupied (%)
Houses owner occupied (% change since 2000)
Houses renter occupied (%)
Houses renter occupied (% change since 2000)
Vacant housing units - For rent (%)
Vacant housing units - For rent (% change since 2000)
Vacant housing units - For sale only (%)
Vacant housing units - For sale only (% change since 2000)
Vacant housing units - Rented or sold, not occupied (%)
Vacant housing units - Rented or sold, not occupied (% change since 2000)
Vacant housing units - For seasonal, recreational, or occasional use (%)
Vacant housing units - For seasonal, recreational, or occasional use (% change since 2000)
Vacant housing units - For migrant workers (%)
Vacant housing units - For migrant workers (% change since 2000)
Vacant housing units - Other vacant (%)
Vacant housing units - Other vacant (% change since 2000)
Median monthly housing costs ($)
Median household income for houses/condos with a mortgage ($)
Median household income for houses/condos without a mortgage ($)
Median household income ($)
Median household income ($) - White
Median household income ($) - Black or African American
Median household income ($) - Asian
Median household income ($) - Hispanic or Latino
Median household income ($) - American Indian and Alaska Native
Median household income ($) - Multirace
Median household income ($) - Other Race
Mortgage status - with mortgage (%)
Mortgage status - with second mortgage (%)
Mortgage status - with home equity loan (%)
Mortgage status - with both second mortgage and home equity loan (%)
Mortgage status - without a mortgage (%)
Median year house/condo built
Median year apartment built
Household type by relationship - Male householder living alone (%)
Household type by relationship - Male householder not living alone (%)
Household type by relationship - Female householder living alone (%)
Household type by relationship - Female householder not living alone (%)
Household type by relationship - Opposite-Sex spouse (%)
Household type by relationship - Same-Sex spouse (%)
Household type by relationship - Opposite-Sex unmarried partner (%)
Household type by relationship - Same-Sex unmarried partner (%)
Household type by relationship - In group quarters (%)
Size of family households - 2-person household (%)
Size of family households - 3-person household (%)
Size of family households - 4-person household (%)
Size of family households - 5-person household (%)
Size of family households - 6-person household (%)
Size of family households - 7-or-more-person household (%)
Size of nonfamily households - 1-person household (%)
Size of nonfamily households - 2-person household (%)
Size of nonfamily households - 3-person household (%)
Size of nonfamily households - 4-person household (%)
Size of nonfamily households - 5-person household (%)
Size of nonfamily households - 6-person household (%)
Size of nonfamily households - 7-or-moreperson household (%)
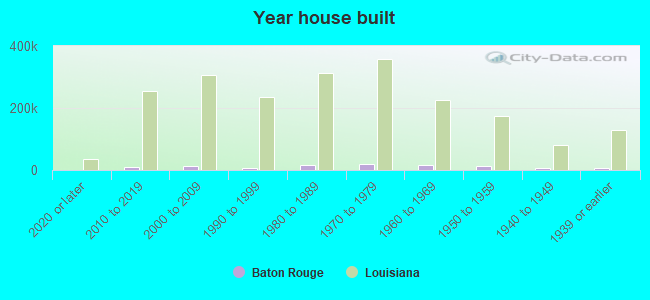
Year house built - Built 2010 or later (%)
Year house built - Built 2000 to 2009 (%)
Year house built - Built 1990 to 1999 (%)
Year house built - Built 1980 to 1989 (%)
Year house built - Built 1970 to 1979 (%)
Year house built - Built 1960 to 1969 (%)
Year house built - Built 1950 to 1959 (%)
Year house built - Built 1940 to 1949 (%)
Year house built - Built 1939 or earlier (%)
Median number of rooms in houses and condos
Median number of rooms in apartments
Median number of bedrooms in owner occupied houses
Mean number of bedrooms in owner occupied houses
Median number of bedrooms in renter occupied houses
Mean number of bedrooms in renter occupied houses
Median number of vehichles in owner occupied houses
Mean number of vehichles in owner occupied houses
Median number of vehichles in renter occupied houses
Mean number of vehichles in renter occupied houses
Rooms in owner-occupied houses - 1 room (%)
Rooms in owner-occupied houses - 2 rooms (%)
Rooms in owner-occupied houses - 3 rooms (%)
Rooms in owner-occupied houses - 4 rooms (%)
Rooms in owner-occupied houses - 5 rooms (%)
Rooms in owner-occupied houses - 6 rooms (%)
Rooms in owner-occupied houses - 7 rooms (%)
Rooms in owner-occupied houses - 8 rooms (%)
Rooms in owner-occupied houses - 9+ rooms (%)
Rooms in renter-occupied houses - 1 room (%)
Rooms in renter-occupied houses - 2 rooms (%)
Rooms in renter-occupied houses - 3 rooms (%)
Rooms in renter-occupied houses - 4 rooms (%)
Rooms in renter-occupied houses - 5 rooms (%)
Rooms in renter-occupied houses - 6 rooms (%)
Rooms in renter-occupied houses - 7 rooms (%)
Rooms in renter-occupied houses - 8 rooms (%)
Rooms in renter-occupied houses - 9+ rooms (%)
Bedrooms in owner-occupied houses - no bedrooms (%)
Bedrooms in owner-occupied houses - 1 bedroom (%)
Bedrooms in owner-occupied houses - 2 bedrooms (%)
Bedrooms in owner-occupied houses - 3 bedrooms (%)
Bedrooms in owner-occupied houses - 4 bedrooms (%)
Bedrooms in owner-occupied houses - 5+ bedrooms (%)
Bedrooms in renter-occupied houses - no bedrooms (%)
Bedrooms in renter-occupied houses - 1 bedroom (%)
Bedrooms in renter-occupied houses - 2 bedrooms (%)
Bedrooms in renter-occupied houses - 3 bedrooms (%)
Bedrooms in renter-occupied houses - 4 bedrooms (%)
Bedrooms in renter-occupied houses - 5+ bedrooms (%)
Vehicles available in owner-occupied houses - no vehicle available (%)
Vehicles available in owner-occupied houses - 1 vehicle available(%)
Vehicles available in owner-occupied houses - 2 Vehicles available (%)
Vehicles available in owner-occupied houses - 3 Vehicles available (%)
Vehicles available in owner-occupied houses - 4 Vehicles available (%)
Vehicles available in owner-occupied houses - 5+ Vehicles available (%)
Vehicles available in renter-occupied houses - no vehicle available (%)
Vehicles available in renter-occupied houses - 1 vehicle available (%)
Vehicles available in renter-occupied houses - 2 Vehicles available (%)
Vehicles available in renter-occupied houses - 3 Vehicles available (%)
Vehicles available in renter-occupied houses - 4 Vehicles available (%)
Vehicles available in renter-occupied houses - 5+ Vehicles available (%)
Housing units in structures - 1, detached (%)
Housing units in structures - 1, attached (%)
Housing units in structures - 2 (%)
Housing units in structures - 3 or 4 (%)
Housing units in structures - 5 to 9 (%)
Housing units in structures - 10 to 19 (%)
Housing units in structures - 20 to 49 (%)
Housing units in structures - 50 or more (%)
Housing units in structures - Mobile home (%)
Housing units in structures - Boat, RV, van, etc. (%)
Housing units in structures - Owners - 1, detached (%)
Housing units in structures - Owners - 1, attached (%)
Housing units in structures - Owners - 2 (%)
Housing units in structures - Owners - 3 or 4 (%)
Housing units in structures - Owners - 5 to 9 (%)
Housing units in structures - Owners - 10 to 19 (%)
Housing units in structures - Owners - 20 to 49 (%)
Housing units in structures - Owners - 50 or more (%)
Housing units in structures - Owners - Mobile home (%)
Housing units in structures - Owners - Boat, RV, van, etc. (%)
Housing units in structures - Renters - 1, detached (%)
Housing units in structures - Renters - 1, attached (%)
Housing units in structures - Renters - 2 (%)
Housing units in structures - Renters - 3 or 4 (%)
Housing units in structures - Renters - 5 to 9 (%)
Housing units in structures - Renters - 10 to 19 (%)
Housing units in structures - Renters - 20 to 49 (%)
Housing units in structures - Renters - 50 or more (%)
Housing units in structures - Renters - Mobile home (%)
Housing units in structures - Renters - Boat, RV, van, etc. (%)
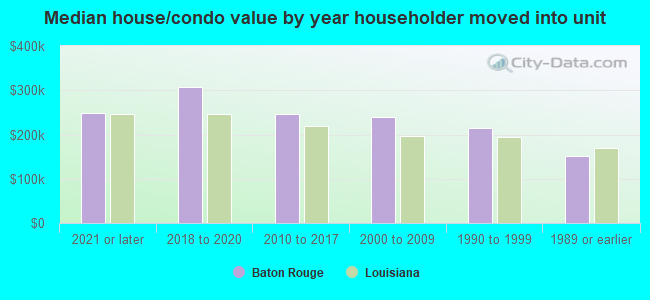
House/condo owner moved in on average (years ago)
Renter moved in on average (years ago)
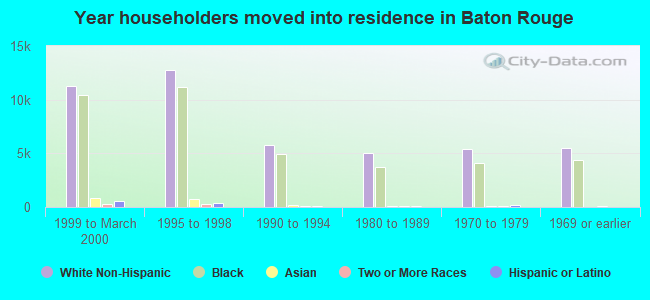
Year householder moved into unit - Moved in 1999 to March 2000 (%)
Year householder moved into unit - Moved in 1999 to March 2000 (%) - White
Year householder moved into unit - Moved in 1999 to March 2000 (%) - Black or African American
Year householder moved into unit - Moved in 1999 to March 2000 (%) - Asian
Year householder moved into unit - Moved in 1999 to March 2000 (%) - Hispanic or Latino
Year householder moved into unit - Moved in 1999 to March 2000 (%) - American Indian and Alaska Native
Year householder moved into unit - Moved in 1999 to March 2000 (%) - Multirace
Year householder moved into unit - Moved in 1999 to March 2000 (%) - Other Race
Year householder moved into unit - Moved in 1995 to 1998 (%)
Year householder moved into unit - Moved in 1995 to 1998 (%) - White
Year householder moved into unit - Moved in 1995 to 1998 (%) - Black or African American
Year householder moved into unit - Moved in 1995 to 1998 (%) - Asian
Year householder moved into unit - Moved in 1995 to 1998 (%) - Hispanic or Latino
Year householder moved into unit - Moved in 1995 to 1998 (%) - American Indian and Alaska Native
Year householder moved into unit - Moved in 1995 to 1998 (%) - Multirace
Year householder moved into unit - Moved in 1995 to 1998 (%) - Other Race
Year householder moved into unit - Moved in 1990 to 1994 (%)
Year householder moved into unit - Moved in 1990 to 1994 (%) - White
Year householder moved into unit - Moved in 1990 to 1994 (%) - Black or African American
Year householder moved into unit - Moved in 1990 to 1994 (%) - Asian
Year householder moved into unit - Moved in 1990 to 1994 (%) - Hispanic or Latino
Year householder moved into unit - Moved in 1990 to 1994 (%) - American Indian and Alaska Native
Year householder moved into unit - Moved in 1990 to 1994 (%) - Multirace
Year householder moved into unit - Moved in 1990 to 1994 (%) - Other Race
Year householder moved into unit - Moved in 1980 to 1989 (%)
Year householder moved into unit - Moved in 1980 to 1989 (%) - White
Year householder moved into unit - Moved in 1980 to 1989 (%) - Black or African American
Year householder moved into unit - Moved in 1980 to 1989 (%) - Asian
Year householder moved into unit - Moved in 1980 to 1989 (%) - Hispanic or Latino
Year householder moved into unit - Moved in 1980 to 1989 (%) - American Indian and Alaska Native
Year householder moved into unit - Moved in 1980 to 1989 (%) - Multirace
Year householder moved into unit - Moved in 1980 to 1989 (%) - Other Race
Year householder moved into unit - Moved in 1970 to 1979 (%)
Year householder moved into unit - Moved in 1970 to 1979 (%) - White
Year householder moved into unit - Moved in 1970 to 1979 (%) - Black or African American
Year householder moved into unit - Moved in 1970 to 1979 (%) - Asian
Year householder moved into unit - Moved in 1970 to 1979 (%) - Hispanic or Latino
Year householder moved into unit - Moved in 1970 to 1979 (%) - American Indian and Alaska Native
Year householder moved into unit - Moved in 1970 to 1979 (%) - Multirace
Year householder moved into unit - Moved in 1970 to 1979 (%) - Other Race
Year householder moved into unit - Moved in 1969 or earlier (%)
Year householder moved into unit - Moved in 1969 or earlier (%) - White
Year householder moved into unit - Moved in 1969 or earlier (%) - Black or African American
Year householder moved into unit - Moved in 1969 or earlier (%) - Asian
Year householder moved into unit - Moved in 1969 or earlier (%) - Hispanic or Latino
Year householder moved into unit - Moved in 1969 or earlier (%) - American Indian and Alaska Native
Year householder moved into unit - Moved in 1969 or earlier (%) - Multirace
Year householder moved into unit - Moved in 1969 or earlier (%) - Other Race
Housing units lacking complete plumbing facilities (%)
Housing units lacking complete kitchen facilities (%)
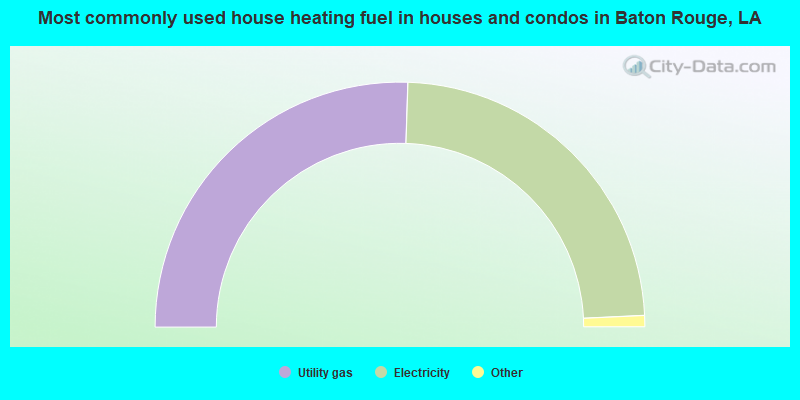
House heating fuel used in houses and condos - Utility gas (%)
House heating fuel used in houses and condos - Bottled, tank, or LP gas (%)
House heating fuel used in houses and condos - Electricity (%)
House heating fuel used in houses and condos - Fuel oil, kerosene, etc. (%)
House heating fuel used in houses and condos - Coal or coke (%)
House heating fuel used in houses and condos - Wood (%)
House heating fuel used in houses and condos - Solar energy (%)
House heating fuel used in houses and condos - Other fuel (%)
House heating fuel used in houses and condos - No fuel used (%)
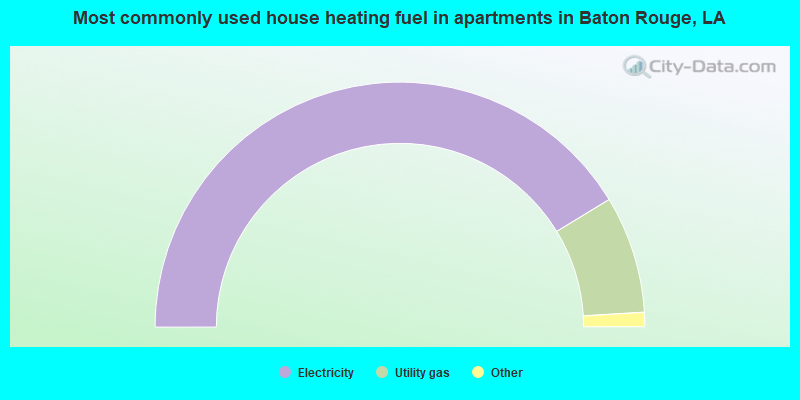
House heating fuel used in apartments - Utility gas (%)
House heating fuel used in apartments - Bottled, tank, or LP gas (%)
House heating fuel used in apartments - Electricity (%)
House heating fuel used in apartments - Fuel oil, kerosene, etc. (%)
House heating fuel used in apartments - Coal or coke (%)
House heating fuel used in apartments - Wood (%)
House heating fuel used in apartments - Solar energy (%)
House heating fuel used in apartments - Other fuel (%)
House heating fuel used in apartments - No fuel used (%)
Median year house/condo built: 1971Median year apartment built: 1981Household type by relationship:
Households: 221,451
Male householders: 39,076 (15,468 living alone ), Female householders: 50,128 (18,932 living alone )25,043 spouses (24,708 opposite-sex spouses ), 6,682 unmarried partners , (5,962 opposite-sex unmarried partners ), 57,424 children (55,968 natural , 694 adopted , 762 stepchildren ), 8,509 grandchildren , 3,878 brothers or sisters , 778 parents , 0 foster children , 4,618 other relatives , 10,911 non-relatives In group quarters: 14,404
Size of family households: 24,704 2-persons , 8,799 3-persons , 6,527 4-persons , 3,791 5-persons , 872 6-persons , 372 7-or-more-persons .
Size of nonfamily households: 34,400 1-person , 6,188 2-persons , 2,667 3-persons , 725 4-persons , 90 5-persons , 69 7-or-more-persons .
14,610 married couples with children. single-parent households (2,674 men , 21,682 women ).
91.5% of residents of Baton Rouge speak English at home. of residents speak Spanish at home (48% speak English very well , 16% speak English well , 19% speak English not well , 17% don't speak English at all ).of residents speak other Indo-European language at home (73% speak English very well , 25% speak English well , 2% speak English not well ).of residents speak Asian or Pacific Island language at home (57% speak English very well , 22% speak English well , 17% speak English not well , 5% don't speak English at all ).of residents speak other language at home (60% speak English very well , 25% speak English well , 11% speak English not well , 4% don't speak English at all ).
Foreign born population: 15,594 (7.0%)of them are naturalized citizens )
Median number of rooms in houses and condos:
Median number of rooms in apartments
Owner-occupied Renter-occupied
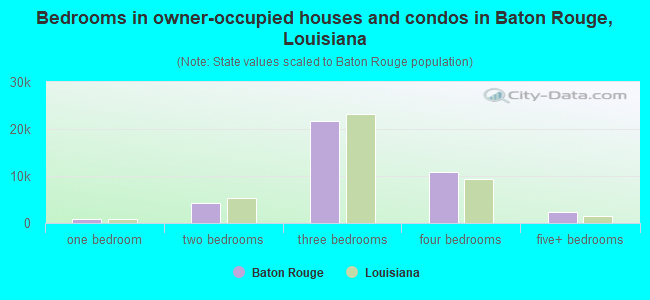
Bedrooms in owner-occupied houses and condos in Baton Rouge, Louisiana
129 no bedroom 919 1 bedroom 4,277 2 bedrooms 21,777 3 bedrooms 10,799 4 bedrooms 2,294 5+ bedrooms
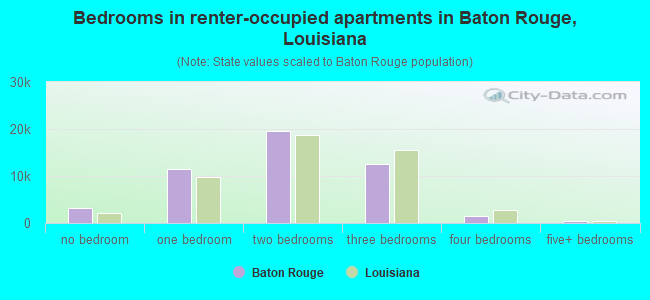
Bedrooms in renter-occupied apartments in Baton Rouge, Louisiana
3,221 no bedroom 11,525 1 bedroom 19,663 2 bedrooms 12,612 3 bedrooms 1,532 4 bedrooms 456 5+ bedrooms
Owner-occupied Renter-occupied
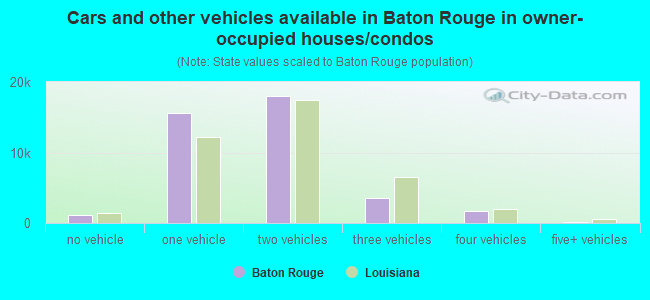
Cars and other vehicles available in Baton Rouge in owner-occupied houses/condos
1,200 no vehicle 15,613 1 vehicle 18,001 2 vehicles 3,518 3 vehicles 1,753 4 vehicles 110 5+ vehicles
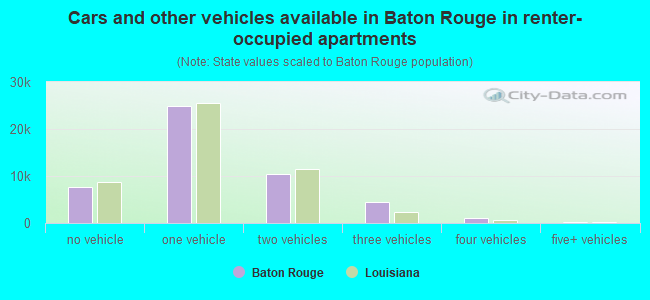
Cars and other vehicles available in Baton Rouge in renter-occupied apartments
7,750 no vehicle 24,910 1 vehicle 10,461 2 vehicles 4,541 3 vehicles 1,039 4 vehicles 308 5+ vehicles
Owner-occupied Renter-occupied
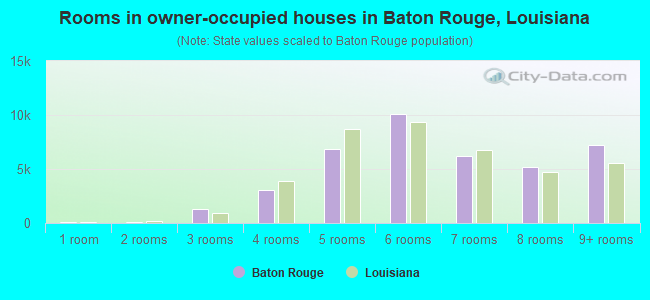
Rooms in owner-occupied houses in Baton Rouge, Louisiana
129 1 room 69 2 rooms 1,273 3 rooms 3,065 4 rooms 6,873 5 rooms 10,121 6 rooms 6,244 7 rooms 5,213 8 rooms 7,208 9+ rooms
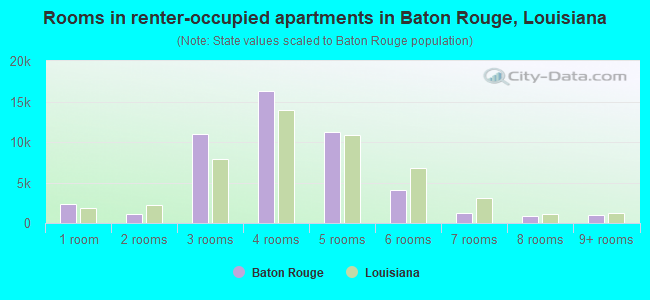
Rooms in renter-occupied apartments in Baton Rouge, Louisiana
2,332 1 room 1,100 2 rooms 10,987 3 rooms 16,262 4 rooms 11,288 5 rooms 4,052 6 rooms 1,215 7 rooms 815 8 rooms 958 9+ rooms
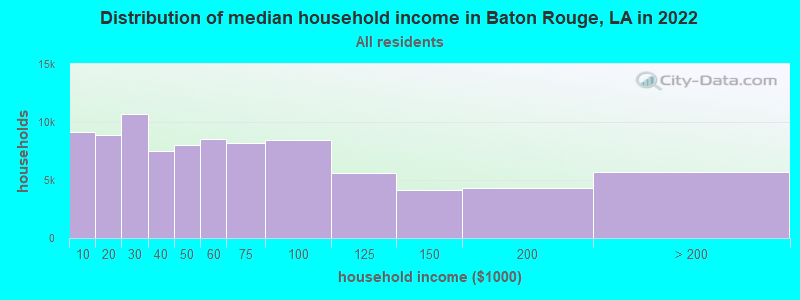
Baton Rouge, LA household income distribution 9,173 Less than $10,0008,838 $10,000 to $19,99910,729 $20,000 to $29,9997,514 $30,000 to $39,9997,978 $40,000 to $49,9998,568 $50,000 to $59,9998,188 $60,000 to $74,9998,423 $75,000 to $99,9995,619 $100,000 to $124,9994,173 $125,000 to $149,9994,275 $150,000 to $199,9995,726 $200,000 or more
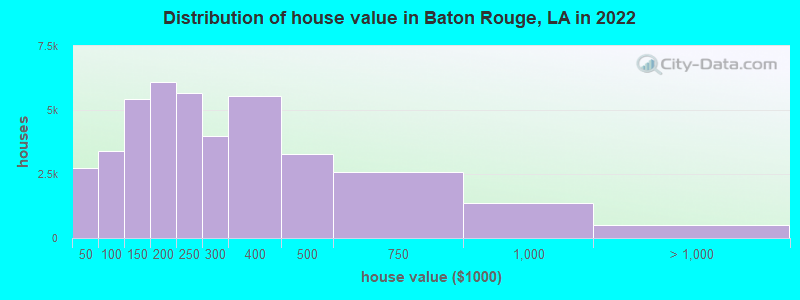
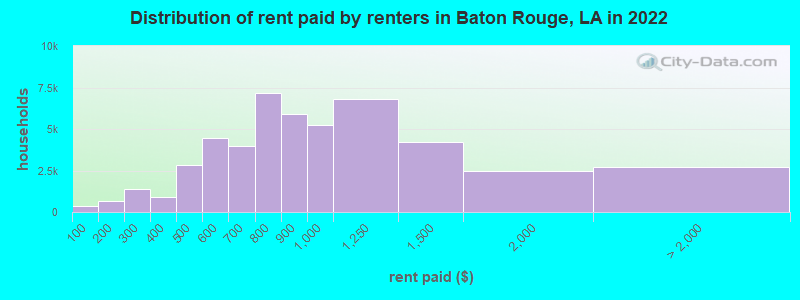
Home value of owner - occupied houses in 2022 in Baton Rouge, LA 377 Less than $10,000178 $10,000 to $14,999117 $15,000 to $19,999107 $20,000 to $24,9991,400 $25,000 to $29,999248 $30,000 to $34,999325 $40,000 to $49,999739 $50,000 to $59,999439 $60,000 to $69,999402 $70,000 to $79,999641 $80,000 to $89,999834 $90,000 to $99,9993,146 $100,000 to $124,9992,277 $125,000 to $149,9992,974 $150,000 to $174,9993,101 $175,000 to $199,9995,671 $200,000 to $249,9993,967 $250,000 to $299,9995,536 $300,000 to $399,9993,275 $400,000 to $499,9992,560 $500,000 to $749,9991,380 $750,000 to $999,999222 $1,000,000 to $1,499,99952 $1,500,000 to $1,999,999227 $2,000,000 or moreRent paid by renters in 2022 in Baton Rouge, LA 335 Less than $100274 $100 to $149382 $150 to $1991,102 $200 to $249271 $250 to $299316 $300 to $349615 $350 to $3991,669 $400 to $4491,153 $450 to $4992,387 $500 to $5492,053 $550 to $5991,954 $600 to $6492,020 $650 to $6993,243 $700 to $7493,940 $750 to $7995,900 $800 to $8995,258 $900 to $9996,797 $1,000 to $1,2494,191 $1,250 to $1,4992,458 $1,500 to $1,999313 $2,000 to $2,49986 $3,000 to $3,499539 $3,500 or more1,753 No cash rent
Percentage of workers working in this county: 85.5%Number of people working at home: 8,476 (8.2% of all workers )
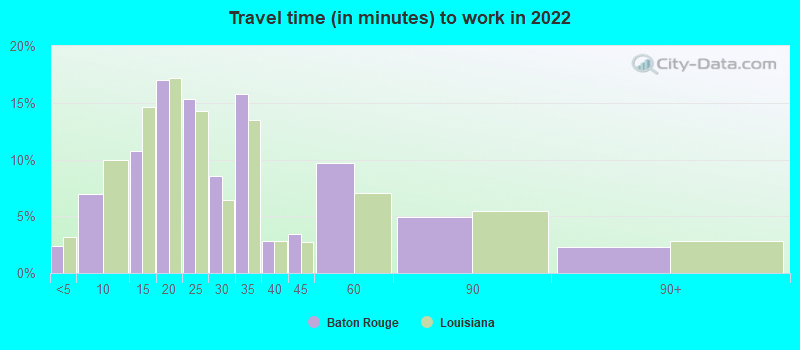
Travel time to work (commute)
Less than 5 minutes: 1,5605 to 9 minutes: 8,39010 to 14 minutes: 14,29315 to 19 minutes: 23,78520 to 24 minutes: 18,13225 to 29 minutes: 7,32830 to 34 minutes: 11,90735 to 39 minutes: 33340 to 44 minutes: 1,71345 to 59 minutes: 4,76760 to 89 minutes: 1,32690 or more minutes: 1,880
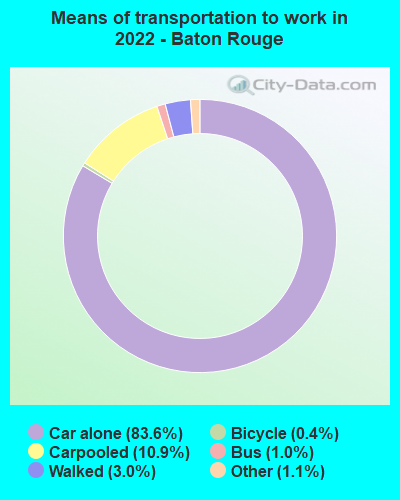
Means of transportation to work:
Drove a car alone: 136,351 (79.5%)Carpooled: 17,762 (10.4%)Bus : 1,618 (0.9%)Taxi: 1,747 (1.0%)Bicycle: 647 (0.4%)Walked: 4,894 (2.9%)Worked at home: 8,476 (4.9%)
Unemployment by race in 2022
Unemployment rate for White non-Hispanic residents 1.7% Males0.8% FemalesUnemployment rate for Black residents 8.9% Males10.3% FemalesUnemployment rate for Asian residents 4.5% Males7.8% FemalesUnemployment rate for other race residents 1.2% Males28.2% FemalesUnemployment rate for two or more race residents 24.9% Males11.7% FemalesUnemployment rate for Hispanic or Latino residents 3.2% Males13.8% Females
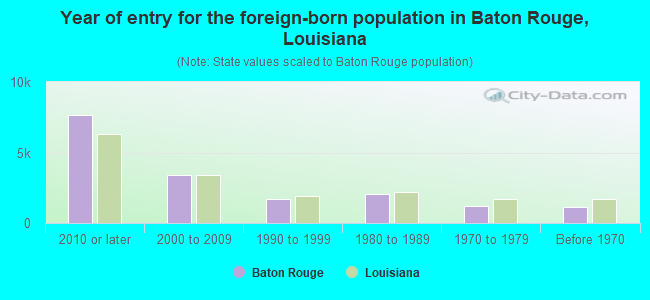
Year of entry for the foreign-born population in Baton Rouge, Louisiana
7,651 2010 or later 3,418 2000 to 2009 1,713 1990 to 1999 2,046 1980 to 1989 1,231 1970 to 1979 1,122 Before 1970
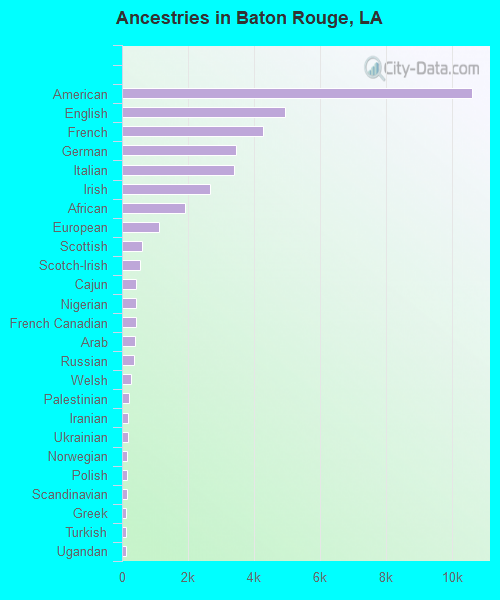
First ancestries reported:
American: 10,598 (7.5%)
English: 4,949 (3.5%)
French: 4,264 (3.0%)
German: 3,458 (2.4%)
Italian: 3,404 (2.4%)
Irish: 2,670 (1.9%)
African: 1,905 (1.3%)
European: 1,108 (0.8%)
Scottish: 615 (0.4%)
Scotch-Irish: 550 (0.4%)
Cajun: 425 (0.3%)
Nigerian: 419 (0.3%)
French Canadian: 411 (0.3%)
Arab: 392 (0.3%)
Russian: 363 (0.3%)
Welsh: 273 (0.2%)
Palestinian: 200 (0.1%)
Iranian: 194 (0.1%)
Ukrainian: 186 (0.1%)
Norwegian: 164 (0.1%)
Polish: 161 (0.1%)
Scandinavian: 157 (0.1%)
Greek: 133 (0.09%)
Turkish: 131 (0.09%)
Ugandan: 122 (0.09%)
Lebanese: 117 (0.08%)
Swedish: 115 (0.08%)
Ghanaian: 110 (0.08%)
Dutch: 97 (0.07%)
Australian: 83 (0.06%)
British: 82 (0.06%)
Jamaican: 64 (0.05%)
Egyptian: 62 (0.04%)
Moroccan: 54 (0.04%)
Armenian: 48 (0.03%)
Syrian: 43 (0.03%)
Canadian: 42 (0.03%)
Northern European: 40 (0.03%)
Swiss: 39 (0.03%)
Lithuanian: 36 (0.03%)
Trinidadian and Tobagonian: 34 (0.02%)
Bulgarian: 30 (0.02%)
Czech: 29 (0.02%)
Macedonian: 28 (0.02%)
Romanian: 24 (0.02%)
Belizean: 24 (0.02%)
Sudanese: 22 (0.02%)
Zimbabwean: 22 (0.02%)
Eastern European: 19 (0.01%)
Austrian: 18 (0.01%)
Hungarian: 17 (0.01%)
Portuguese: 16 (0.01%)
Belgian: 15 (0.01%)
Slovene: 14 (0.01%)
Finnish: 13 (0.01%)
Celtic: 12 (0.01%)
Basque: 10 (0.01%)
Ethiopian: 10 (0.01%)
Most common places of birth for foreign-born residents (%): Vietnam Baton Rouge:
17.7% (2,564)Louisiana:
9.2% (18,115)
Honduras Baton Rouge:
13.3% (1,924)Louisiana:
18.9% (37,225)
China, excluding Hong Kong and Taiwan Baton Rouge:
6.2% (903)Louisiana:
3.4% (6,779)
Bangladesh Baton Rouge:
4.6% (669)Louisiana:
0.7% (1,446)
El Salvador Baton Rouge:
4.5% (651)Louisiana:
2.2% (4,241)
India Baton Rouge:
4.2% (604)Louisiana:
3.9% (7,741)
Philippines Baton Rouge:
4.0% (580)Louisiana:
3.1% (6,086)
Nicaragua Baton Rouge:
3.7% (534)Louisiana:
2.1% (4,115)
Yemen Baton Rouge:
3.3% (482)Louisiana:
0.5% (935)
Mexico Baton Rouge:
2.7% (394)Louisiana:
12.1% (23,732)
Guatemala Baton Rouge:
2.7% (393)Louisiana:
2.8% (5,576)
Germany Baton Rouge:
1.9% (282)Louisiana:
1.6% (3,186)
Nigeria Baton Rouge:
1.9% (281)Louisiana:
1.0% (2,002)
Korea Baton Rouge:
1.9% (272)Louisiana:
1.0% (1,951)
Iran Baton Rouge:
1.6% (232)Louisiana:
0.7% (1,368)
Russia Baton Rouge:
1.5% (221)Louisiana:
0.7% (1,435)
Place of birth for U.S.-born residents:
This state: 165,386Other state: 39,454Northeast: 6,749Midwest: 7,132South: 22,154West: 3,419 75.6% of Baton Rouge residents lived in the same house 1 years ago.
Out of people who lived in different houses, 37.9% lived in this county.
Out of people who lived in different counties, 59.2% lived in Louisiana.
Baton Rouge:
75.6%State average:
88.3%
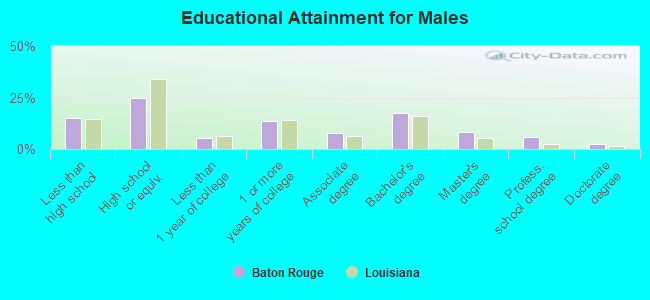
Education attainment for males 25 years and older:
No schooling: 906Nursery to 4th grade: 6565th and 6th grade: 1,1447th and 8th grade: 3819th grade: 35710th grade: 79211th grade: 2,28212th grade, no diploma: 2,496High school graduate (or equivalency): 15,042Less than 1 year of college: 3,127Some college more than 1 year, no degree: 8,211Associate degree: 4,799Bachelor's degree: 10,675Master's degree: 4,992Professional school degree: 3,494Doctorate degree: 1,426
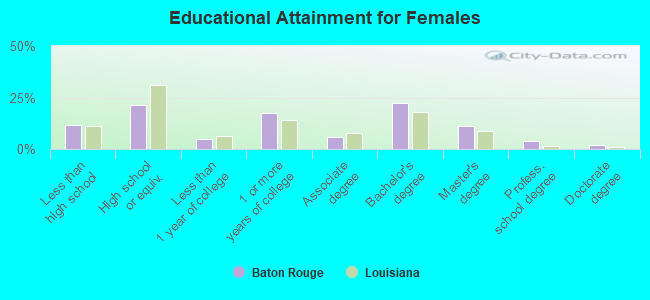
Education attainment for females 25 years and older:
No schooling: 976Nursery to 4th grade: 1815th and 6th grade: 2947th and 8th grade: 2619th grade: 1,22710th grade: 1,68011th grade: 1,96812th grade, no diploma: 1,555High school graduate (or equivalency): 15,340Less than 1 year of college: 3,379Some college more than 1 year, no degree: 12,457Associate degree: 4,131Bachelor's degree: 15,722Master's degree: 7,850Professional school degree: 2,645Doctorate degree: 1,450
Housing units in structures:
One, detached: 57,376One, attached: 3,303Two: 2,5393 or 4: 10,5475 to 9: 7,67110 to 19: 6,59020 to 49: 7,36550 or more: 10,036Mobile homes: 722Boats, RVs, vans, etc.: 53Median worth of mobile homes: $31,130
Housing units lacking complete plumbing facilities in 2022: 5.0%Housing units lacking complete kitchen facilities in 2022: 5.4%House/condo owner moved in on average 15 years ago
Renter moved in on average 2 years ago
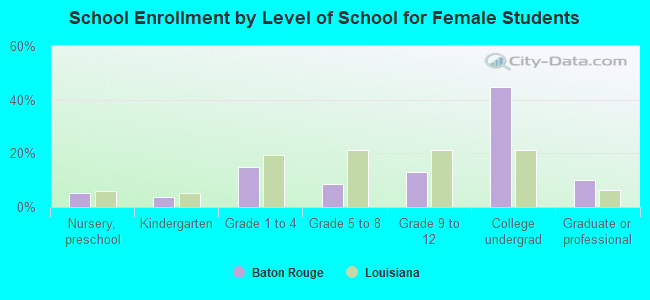
Private vs. public school enrollment:
Students in private schools in grades 1 to 8 (elementary and middle school): 4,735 Here:
23.2%Louisiana:
19.6%
Students in private schools in grades 9 to 12 (high school): 1,442 Here:
17.8%Louisiana:
18.3%
Students in private undergraduate colleges: 2,143