Austin, TX (Texas) Houses and Residents
| Austin: | $593,000 |
| Texas: | $275,400 |
Mean price in 2022:
Detached houses: $737,673
Here: $737,673 State: $369,058 Townhouses or other attached units: $533,017
Here: $533,017 State: $327,631 In 2-unit structures: $1,093,219
Here: $1,093,219 State: $374,947 In 3-to-4-unit structures: $301,152
Here: $301,152 State: $209,652 In 5-or-more-unit structures: $800,345
Here: $800,345 State: $413,944 Mobile homes: $105,214
Here: $105,214 State: $124,413
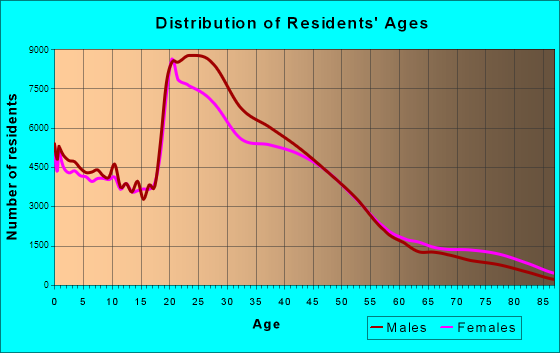
Total population: 912,791 (Urban population: 649,620 (649,408 inside urbanized areas, 212 inside urban clusters), Rural population: 6,682 (47 farm, 6,635 nonfarm))
Houses: 482,411 (458,505 occupied: 202,696 owner occupied, 255,809 renter occupied)
| % of renters here: | 56% |
| State: | 38% |
Housing density: 1,918 houses/condos per square mile
Median price asked for vacant for-sale houses and condos in 2022: $850,952.
Median contract rent in 2022: $1,436 (lower quartile is $1,136, upper quartile is $1,875)
Median rent asked for vacant for-rent units in 2022: $1,698
Median gross rent in Austin, TX in 2022: $1,581
Housing units in Austin with a mortgage: 138,844 (8,269 second mortgage, 571 home equity loan, 6,072 both second mortgage and home equity loan)
Houses without a mortgage: 1,909
Median household income for houses/condos with a mortgage: $153,484
Median household income for apartments without a mortgage: $97,899
Median monthly housing costs: $1,688
Compare current foreclosures in Austin, TX:
| Photo | Address | Area | Beds / Baths | Price | Details |
|---|---|---|---|---|---|

|
#1
Jacqueline Ln
Austin, TX 78724
|
2,117 sq. feet
|
2 baths 6 beds |
$445,000
|
show details |

|
#2
N Redondo Dr
Austin, TX 78721
|
972 sq. feet
|
1 baths 3 beds |
$339,900
|
show details |

|
#3
Exposition Blvd
Austin, TX 78703
|
2,156 sq. feet
|
2 baths 3 beds |
show details | |

|
#4
Boggy Ridge Dr
Austin, TX 78748
|
1,129 sq. feet
|
2 baths 3 beds |
show details | |

|
#5
Romayne Ln
Austin, TX 78748
|
1,372 sq. feet
|
2 baths 3 beds |
show details | |

|
#6
Liberton Ln
Austin, TX 78754
|
- sq. feet
|
2 baths 3 beds |
show details | |

|
#7
White Sands Dr
Austin, TX 78734
|
2,256 sq. feet
|
2 baths 4 beds |
show details | |

|
#8
Knockfin Dr
Austin, TX 78744
|
- sq. feet
|
3 baths 4 beds |
show details | |

|
#9
Dovemeadow Dr
Austin, TX 78744
|
1,194 sq. feet
|
2 baths 3 beds |
show details | |

|
#10
Howerington Cir
Austin, TX 78724
|
870 sq. feet
|
1 baths - beds |
show details |
| Photo | Address | Area | Beds / Baths | Price | Details |
|---|---|---|---|---|---|

|
#11
Rolling Green Dr
Austin, TX 78734
|
2,289 sq. feet
|
3 baths 4 beds |
show details | |

|
#12
Payton Falls Dr
Austin, TX 78754
|
2,828 sq. feet
|
2 baths - beds |
show details | |

|
#13
Stoney Creek Cv
Austin, TX 78734
|
1,794 sq. feet
|
2 baths - beds |
show details | |

|
#14
Cedar Ave
Austin, TX 78722
|
1,294 sq. feet
|
1 baths - beds |
show details | |

|
#15
Barcelona Dr
Austin, TX 78752
|
2,096 sq. feet
|
2 baths - beds |
show details | |

|
#16
E 12th St # B
Austin, TX 78702
|
1,582 sq. feet
|
3 baths - beds |
show details | |

|
#17
Lake Stone Dr
Austin, TX 78738
|
1,838 sq. feet
|
2 baths - beds |
show details | |

|
#18
Irongate Cir
Austin, TX 78727
|
1,188 sq. feet
|
2 baths - beds |
show details | |

|
#19
Burnhill Dr
Austin, TX 78745
|
1,531 sq. feet
|
1 baths - beds |
show details | |

|
#20
Almarion Way
Austin, TX 78746
|
1,782 sq. feet
|
1 baths - beds |
show details |
| Photo | Address | Area | Beds / Baths | Price | Details |
|---|---|---|---|---|---|

|
#21
Mateo Cv
Austin, TX 78717
|
2,806 sq. feet
|
2 baths - beds |
show details | |

|
#22
Brodie Ln Unit 4103
Austin, TX 78748
|
1,550 sq. feet
|
2 baths - beds |
show details | |

|
#23
Barkley Dr
Austin, TX 78727
|
1,632 sq. feet
|
2 baths - beds |
show details | |

|
#24
Colfax Dr
Austin, TX 78724
|
1,024 sq. feet
|
1 baths - beds |
show details | |

|
#25
Clearbrook Trl
Austin, TX 78729
|
2,058 sq. feet
|
4 baths - beds |
show details | |

|
#26
Arrow Dr
Austin, TX 78749
|
1,281 sq. feet
|
2 baths - beds |
show details | |

|
#27
Melissa Oaks Ln
Austin, TX 78744
|
2,281 sq. feet
|
2 baths - beds |
show details | |

|
#28
Brooks Hollow R 4
Austin, TX 78734
|
744 sq. feet
|
1 baths - beds |
show details | |

|
#29
Edenbourgh Ln
Austin, TX 78754
|
1,385 sq. feet
|
2 baths - beds |
show details | |

|
#30
Canon Yeomans Trl
Austin, TX 78748
|
1,271 sq. feet
|
2 baths - beds |
show details |
| Photo | Address | Area | Beds / Baths | Price | Details |
|---|---|---|---|---|---|

|
#31
Allyson Ct
Austin, TX 78744
|
1,466 sq. feet
|
2 baths - beds |
show details | |

|
#32
Banbridge Trl
Austin, TX 78717
|
2,448 sq. feet
|
2 baths - beds |
show details | |

|
#33
Firethorn Ln
Austin, TX 78750
|
1,290 sq. feet
|
2 baths - beds |
show details | |

|
#34
Whitewing Ave
Austin, TX 78753
|
846 sq. feet
|
1 baths - beds |
show details | |

|
#35
Coats Cir
Austin, TX 78748
|
1,427 sq. feet
|
2 baths - beds |
show details | |

|
#36
Pyreneese Dr
Austin, TX 78759
|
1,604 sq. feet
|
2 baths - beds |
show details | |

|
#37
Little Walnut Dr
Austin, TX 78753
|
2,050 sq. feet
|
2 baths - beds |
show details | |

|
#38
Ruth Ave
Austin, TX 78757
|
982 sq. feet
|
1 baths - beds |
show details | |

|
#39
Kenwood Ave
Austin, TX 78704
|
1,423 sq. feet
|
2 baths - beds |
show details | |

|
#40
Calaveras Dr
Austin, TX 78717
|
2,612 sq. feet
|
2 baths - beds |
show details |
| Photo | Address | Area | Beds / Baths | Price | Details |
|---|---|---|---|---|---|

|
#41
Wideleaf Dr
Austin, TX 78724
|
1,326 sq. feet
|
2 baths - beds |
show details | |

|
#42
W Milton St
Austin, TX 78704
|
2,420 sq. feet
|
2 baths - beds |
show details | |

|
#43
Auburn Dr
Austin, TX 78723
|
2,040 sq. feet
|
3 baths - beds |
show details | |

|
#44
Mansfield Dr
Austin, TX 78732
|
1,931 sq. feet
|
2 baths - beds |
show details | |

|
#45
Prince Dr
Austin, TX 78752
|
2,096 sq. feet
|
2 baths - beds |
show details | |

|
#46
Westmoor Dr
Austin, TX 78723
|
1,594 sq. feet
|
1 baths - beds |
show details | |

|
#47
Knollwood Dr # B
Austin, TX 78731
|
1,310 sq. feet
|
2 baths - beds |
show details | |

|
#48
Trail Of The Woods
Austin, TX 78734
|
4,267 sq. feet
|
3 baths - beds |
show details | |

|
#49
Grennock Dr
Austin, TX 78745
|
1,571 sq. feet
|
2 baths - beds |
show details | |

|
Check over 1 million property listings on Foreclosure.com!
|
browse all offers | |||

Latest news about housing in Austin, TX collected exclusively by city-data.com from local newspapers, TV, and radio stations

 | Agent referral for home purchase in Austin (3 replies) |
| Will I have trouble renting in Austin with my non-standard proof of income? (20 replies) |
| Great Austin Neighborhoods- Houses to rent for 1200??! (7 replies) |
| Austin Rent Prices Have Dropped...slightly (9 replies) |
| Safe Apartments in Austin (4 replies) |
| prices of homes - Austin (14 replies) |
Median year apartment built: 1999
Household type by relationship:
Households: 975,335- Male householders: 238,669 (88,522 living alone), Female householders: 219,836 (84,414 living alone)
160,269 spouses (155,990 opposite-sex spouses), 52,315 unmarried partners, (46,633 opposite-sex unmarried partners), 192,177 children (181,120 natural, 5,991 adopted, 5,066 stepchildren), 16,218 grandchildren, 10,332 brothers or sisters, 9,518 parents, 133 foster children, 12,080 other relatives, 42,147 non-relatives
- In group quarters: 21,641
Size of family households: 100,561 2-persons, 49,341 3-persons, 41,147 4-persons, 13,110 5-persons, 6,106 6-persons, 2,883 7-or-more-persons.
Size of nonfamily households: 172,936 1-person, 62,444 2-persons, 6,844 3-persons, 2,358 4-persons, 637 5-persons, 138 6-persons.
113,808 married couples with children.
33,600 single-parent households (8,715 men, 24,885 women).
70.4% of residents of Austin speak English at home.
20.5% of residents speak Spanish at home (60% speak English very well, 18% speak English well, 12% speak English not well, 10% don't speak English at all).
3.5% of residents speak other Indo-European language at home (79% speak English very well, 13% speak English well, 8% speak English not well, 1% don't speak English at all).
4.2% of residents speak Asian or Pacific Island language at home (72% speak English very well, 20% speak English well, 5% speak English not well, 3% don't speak English at all).
1.4% of residents speak other language at home (80% speak English very well, 14% speak English well, 6% speak English not well).
Foreign born population: 173,184 (17.8%)
(40.3% of them are naturalized citizens)
| Here: | 6.1 |
| State: | 6.3 |
| Here: | 3.3 |
| State: | 4.0 |

- Bedrooms in owner-occupied houses and condos in Austin, Texas
- 1,619no bedroom
- 7,5441 bedroom
- 26,0252 bedrooms
- 98,5333 bedrooms
- 57,1204 bedrooms
- 11,8555+ bedrooms

- Bedrooms in renter-occupied apartments in Austin, Texas
- 26,935no bedroom
- 97,7581 bedroom
- 86,7772 bedrooms
- 32,1533 bedrooms
- 11,3364 bedrooms
- 8505+ bedrooms

- Cars and other vehicles available in Austin in owner-occupied houses/condos
- 3,465no vehicle
- 62,6841 vehicle
- 96,1922 vehicles
- 28,1623 vehicles
- 8,6984 vehicles
- 3,4955+ vehicles

- Cars and other vehicles available in Austin in renter-occupied apartments
- 30,452no vehicle
- 137,7041 vehicle
- 72,1182 vehicles
- 10,8003 vehicles
- 3,8604 vehicles
- 8755+ vehicles

- Rooms in owner-occupied houses in Austin, Texas
- 1,2951 room
- 2,5372 rooms
- 9,2023 rooms
- 26,7064 rooms
- 38,0055 rooms
- 40,4626 rooms
- 29,6747 rooms
- 26,2798 rooms
- 28,5369+ rooms

- Rooms in renter-occupied apartments in Austin, Texas
- 26,1051 room
- 44,7992 rooms
- 67,2663 rooms
- 57,4944 rooms
- 27,8275 rooms
- 19,3066 rooms
- 6,8937 rooms
- 4,0298 rooms
- 2,0909+ rooms


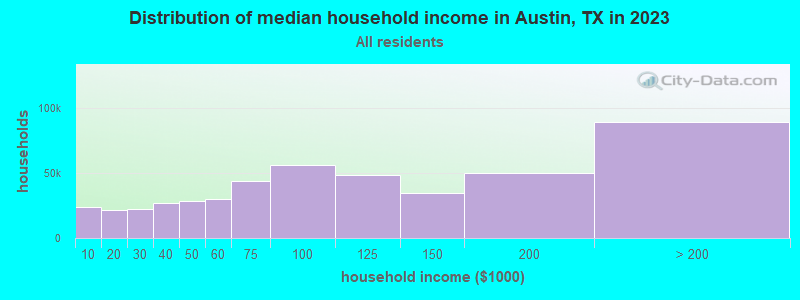
Austin, TX household income distribution

- 23,424Less than $10,000
- 18,558$10,000 to $19,999
- 23,785$20,000 to $29,999
- 25,171$30,000 to $39,999
- 27,052$40,000 to $49,999
- 33,844$50,000 to $59,999
- 41,894$60,000 to $74,999
- 58,726$75,000 to $99,999
- 43,609$100,000 to $124,999
- 33,294$125,000 to $149,999
- 49,253$150,000 to $199,999
- 79,895$200,000 or more
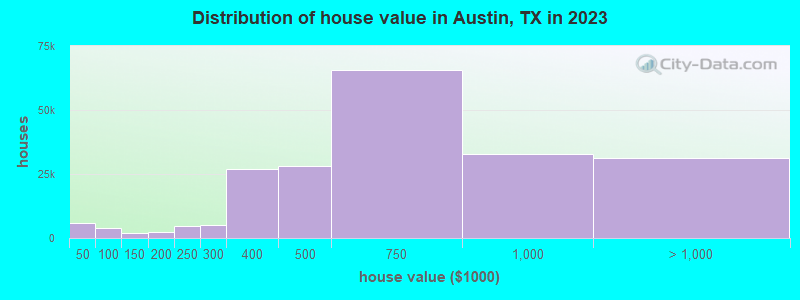
Home value of owner - occupied houses in 2022 in Austin, TX
-
- 1,539Less than $10,000
- 532$10,000 to $14,999
- 169$20,000 to $24,999
- 165$25,000 to $29,999
- 52$30,000 to $34,999
- 240$35,000 to $39,999
- 237$40,000 to $49,999
- 355$50,000 to $59,999
- 809$60,000 to $69,999
- 278$70,000 to $79,999
- 219$80,000 to $89,999
- 156$90,000 to $99,999
- 1,077$100,000 to $124,999
- 350$125,000 to $149,999
- 1,322$150,000 to $174,999
- 1,363$175,000 to $199,999
- 5,635$200,000 to $249,999
- 7,530$250,000 to $299,999
- 20,246$300,000 to $399,999
- 35,035$400,000 to $499,999
- 64,615$500,000 to $749,999
- 29,973$750,000 to $999,999
- 16,493$1,000,000 to $1,499,999
- 6,205$1,500,000 to $1,999,999
- 8,101$2,000,000 or more
Rent paid by renters in 2022 in Austin, TX
-
- 479Less than $100
- 706$100 to $149
- 950$150 to $199
- 2,180$200 to $249
- 683$250 to $299
- 341$300 to $349
- 164$350 to $399
- 622$400 to $449
- 142$450 to $499
- 227$500 to $549
- 1,904$550 to $599
- 596$600 to $649
- 1,657$650 to $699
- 2,216$700 to $749
- 1,733$750 to $799
- 6,377$800 to $899
- 13,818$900 to $999
- 52,034$1,000 to $1,249
- 52,293$1,250 to $1,499
- 66,647$1,500 to $1,999
- 28,765$2,000 to $2,499
- 9,414$2,500 to $2,999
- 3,517$3,000 to $3,499
- 4,627$3,500 or more
- 3,717No cash rent


Percentage of workers working in this county: 91.0%
Number of people working at home: 181,680 (30.7% of all workers)

Travel time to work (commute)
- Less than 5 minutes: 10,932
- 5 to 9 minutes: 30,180
- 10 to 14 minutes: 66,701
- 15 to 19 minutes: 79,418
- 20 to 24 minutes: 71,582
- 25 to 29 minutes: 30,568
- 30 to 34 minutes: 63,458
- 35 to 39 minutes: 11,634
- 40 to 44 minutes: 11,166
- 45 to 59 minutes: 18,433
- 60 to 89 minutes: 11,749
- 90 or more minutes: 4,047

Means of transportation to work:
- Drove a car alone: 497,082 (64.0%)
- Carpooled: 56,746 (7.3%)
- Bus: 12,360 (1.6%)
- Subway or elevated rail: 204 (0.0%)
- Long-distance train or commuter rail: 319 (0.0%)
- Light rail, streetcar or trolley: 365 (0.0%)
- Taxi: 10,444 (1.3%)
- Bicycle: 2,725 (0.4%)
- Walked: 14,628 (1.9%)
- Worked at home: 181,680 (23.4%)

- Unemployment by race in 2022
- Unemployment rate for White non-Hispanic residents
- 2.3%Males
- 2.6%Females
- Unemployment rate for Black residents
- 7.2%Males
- 3.8%Females
- Unemployment rate for American Indian and Alaska Native residents
- 3.2%Males
- 2.6%Females
- Unemployment rate for Asian residents
- 3.8%Males
- 0.6%Females
- Unemployment rate for other race residents
- 4.8%Males
- 3.0%Females
- Unemployment rate for two or more race residents
- 3.3%Males
- 2.5%Females
- Unemployment rate for Hispanic or Latino residents
- 3.5%Males
- 3.4%Females

- Year of entry for the foreign-born population in Austin, Texas
- 84,0572010 or later
- 30,5692000 to 2009
- 27,0001990 to 1999
- 25,5031980 to 1989
- 11,2551970 to 1979
- 6,230Before 1970

First ancestries reported:
- English: 32,540 (6.5%)
- German: 27,086 (5.4%)
- Irish: 19,444 (3.9%)
- American: 18,195 (3.6%)
- European: 15,878 (3.1%)
- Italian: 7,569 (1.5%)
- Scottish: 5,429 (1.1%)
- African: 4,313 (0.9%)
- Scotch-Irish: 4,015 (0.8%)
- French: 3,589 (0.7%)
- Polish: 3,427 (0.7%)
- Nigerian: 3,171 (0.6%)
- Afghan: 3,124 (0.6%)
- Norwegian: 2,563 (0.5%)
- Swedish: 2,342 (0.5%)
- British: 2,308 (0.5%)
- Russian: 2,256 (0.4%)
- Eastern European: 2,010 (0.4%)
- Czech: 1,947 (0.4%)
- Lebanese: 1,435 (0.3%)
- Iranian: 1,294 (0.3%)
- Northern European: 1,272 (0.3%)
- Dutch: 1,265 (0.3%)
- Greek: 1,251 (0.2%)
- Ukrainian: 1,215 (0.2%)
- Turkish: 1,205 (0.2%)
- Ethiopian: 1,140 (0.2%)
- Brazilian: 1,088 (0.2%)
- Jamaican: 921 (0.2%)
- French Canadian: 873 (0.2%)
- Welsh: 785 (0.2%)
- Portuguese: 781 (0.2%)
- Hungarian: 771 (0.2%)
- Syrian: 676 (0.1%)
- Scandinavian: 673 (0.1%)
- Romanian: 653 (0.1%)
- Iraqi: 621 (0.1%)
- Arab: 611 (0.1%)
- Swiss: 459 (0.09%)
- Danish: 449 (0.09%)
- Cajun: 443 (0.09%)
- Austrian: 404 (0.08%)
- Belgian: 371 (0.07%)
- Canadian: 360 (0.07%)
- Serbian: 339 (0.07%)
- Jordanian: 292 (0.06%)
- Czechoslovakian: 287 (0.06%)
- Finnish: 276 (0.05%)
- South African: 257 (0.05%)
- Ghanaian: 257 (0.05%)
- Slovene: 257 (0.05%)
- Lithuanian: 250 (0.05%)
- Egyptian: 234 (0.05%)
- Belizean: 215 (0.04%)
- Haitian: 211 (0.04%)
- Yugoslavian: 190 (0.04%)
- Australian: 180 (0.04%)
- Israeli: 178 (0.04%)
- Kenyan: 160 (0.03%)
- Armenian: 156 (0.03%)
- Croatian: 155 (0.03%)
- Slovak: 154 (0.03%)
- Sudanese: 151 (0.03%)
- Albanian: 150 (0.03%)
- Moroccan: 134 (0.03%)
- Palestinian: 115 (0.02%)
- Trinidadian and Tobagonian: 94 (0.02%)
- Alsatian: 84 (0.02%)
- Barbadian: 79 (0.02%)
- West Indian: 75 (0.01%)
- Ugandan: 69 (0.01%)
- Latvian: 67 (0.01%)
- Slavic: 58 (0.01%)
- New Zealander: 46 (0.01%)
- Dutch West Indian: 40 (0.01%)
- Pennsylvania German: 39 (0.01%)
- Macedonian: 38 (0.01%)
- Bulgarian: 36 (0.01%)
- Basque: 27 (0.01%)
Most common places of birth for foreign-born residents (%):
| Austin: | 29.6% (53,709) |
| Texas: | 48.4% (2,411,723) |
| Austin: | 12.2% (22,192) |
| Texas: | 6.1% (306,347) |
| Austin: | 4.6% (8,303) |
| Texas: | 3.0% (147,182) |
| Austin: | 4.0% (7,197) |
| Texas: | 2.3% (115,558) |
| Austin: | 3.3% (5,996) |
| Texas: | 1.8% (87,382) |
| Austin: | 3.2% (5,768) |
| Texas: | 3.7% (184,770) |
| Austin: | 2.9% (5,330) |
| Texas: | 1.3% (62,978) |
| Austin: | 2.5% (4,557) |
| Texas: | 1.2% (60,172) |
| Austin: | 2.4% (4,326) |
| Texas: | 4.5% (224,455) |
| Austin: | 1.9% (3,514) |
| Texas: | 1.5% (72,413) |
| Austin: | 1.8% (3,345) |
| Texas: | 1.1% (55,371) |
| Austin: | 1.8% (3,305) |
| Texas: | 0.3% (13,197) |
| Austin: | 1.8% (3,271) |
| Texas: | 2.1% (103,148) |
Place of birth for U.S.-born residents:
- This state: 469,843
- Other state: 309,789
- Northeast: 56,201
- Midwest: 84,048
- South: 86,424
- West: 83,116
79.3% of Austin residents lived in the same house 1 years ago.
Out of people who lived in different houses, 35.5% lived in this county.
Out of people who lived in different counties, 52.7% lived in Texas.
| Austin: | 79.3% |
| State average: | 85.7% |
Education attainment for males 25 years and older:
- No schooling: 7,545
- Nursery to 4th grade: 2,589
- 5th and 6th grade: 4,086
- 7th and 8th grade: 1,343
- 9th grade: 2,084
- 10th grade: 1,550
- 11th grade: 2,905
- 12th grade, no diploma: 4,872
- High school graduate (or equivalency): 46,363
- Less than 1 year of college: 14,418
- Some college more than 1 year, no degree: 40,853
- Associate degree: 18,551
- Bachelor's degree: 133,786
- Master's degree: 56,582
- Professional school degree: 14,004
- Doctorate degree: 9,142

Education attainment for females 25 years and older:
- No schooling: 5,593
- Nursery to 4th grade: 2,079
- 5th and 6th grade: 4,981
- 7th and 8th grade: 2,859
- 9th grade: 1,526
- 10th grade: 2,219
- 11th grade: 1,726
- 12th grade, no diploma: 3,497
- High school graduate (or equivalency): 43,443
- Less than 1 year of college: 12,669
- Some college more than 1 year, no degree: 35,085
- Associate degree: 18,289
- Bachelor's degree: 126,408
- Master's degree: 59,082
- Professional school degree: 13,898
- Doctorate degree: 6,811

Housing units in structures:
- One, detached: 215,759
- One, attached: 24,065
- Two: 13,644
- 3 or 4: 17,863
- 5 to 9: 30,022
- 10 to 19: 53,977
- 20 to 49: 42,582
- 50 or more: 81,122
- Mobile homes: 3,063
- Boats, RVs, vans, etc.: 314
Median worth of mobile homes: $68,300
Housing units lacking complete kitchen facilities in 2022: 0.9%
House/condo owner moved in on average 9 years ago
Renter moved in on average 1 years ago

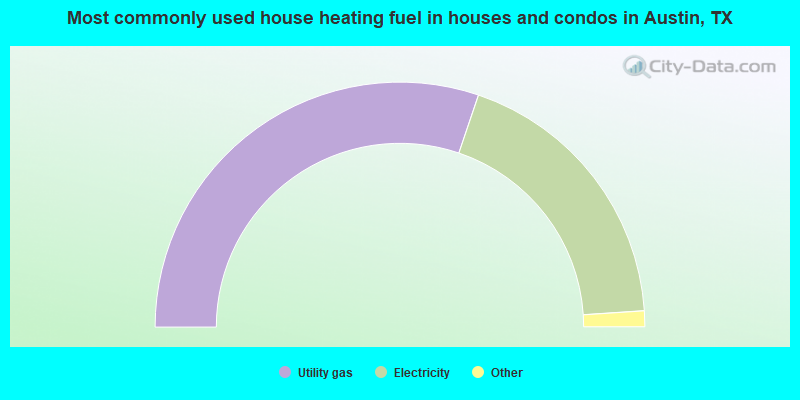
- 59.3%Utility gas
- 38.6%Electricity
- 1.4%Bottled, tank, or LP gas
- 0.4%Solar energy
- 0.1%No fuel used
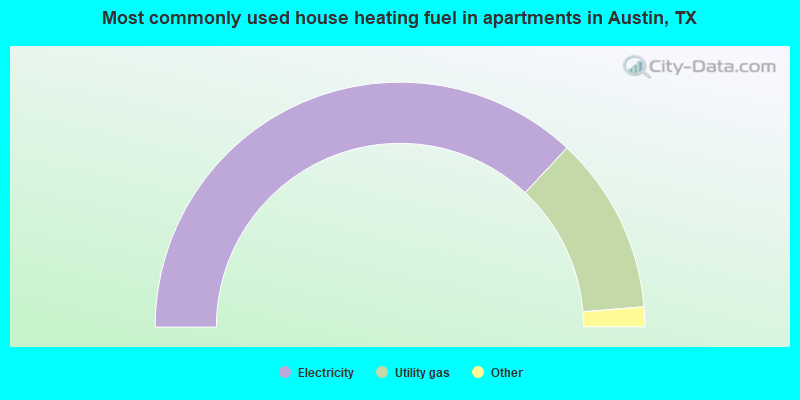
- 73.9%Electricity
- 23.5%Utility gas
- 1.5%Bottled, tank, or LP gas
- 0.6%No fuel used
- 0.2%Other fuel
- 0.1%Solar energy
- 0.1%Fuel oil, kerosene, etc.
Private vs. public school enrollment:
| Here: | 10.2% |
| Texas: | 8.8% |
| Here: | 12.9% |
| Texas: | 8.0% |
| Here: | 12.8% |
| Texas: | 16.2% |


