Aurora, IL (Illinois) Houses and Residents
| Aurora: | $267,100 |
| Illinois: | $251,600 |
Mean price in 2022:
Detached houses: $289,567
Here: $289,567 State: $310,164 Townhouses or other attached units: $220,840
Here: $220,840 State: $286,230 In 2-unit structures: $218,412
Here: $218,412 State: $299,638 In 3-to-4-unit structures: $123,779
Here: $123,779 State: $330,907 In 5-or-more-unit structures: $141,320
Here: $141,320 State: $318,887
Total population: 200,456 (Urban population: 143,462, Rural population: 147 (all nonfarm))
Houses: 66,271 (63,481 occupied: 43,651 owner occupied, 19,830 renter occupied)
| % of renters here: | 31% |
| State: | 33% |
Housing density: 1,720 houses/condos per square mile
Median price asked for vacant for-sale houses and condos in 2022: $454,557.
Median contract rent in 2022: $1,195 (lower quartile is $901, upper quartile is $1,631)
Median rent asked for vacant for-rent units in 2022: $979
Median gross rent in Aurora, IL in 2022: $1,388
Housing units in Aurora with a mortgage: 28,916 (2,325 second mortgage, 0 home equity loan, 2,279 both second mortgage and home equity loan)
Houses without a mortgage: 655
Median household income for houses/condos with a mortgage: $114,763
Median household income for apartments without a mortgage: $77,247
Median monthly housing costs: $1,440
Compare current foreclosures in Aurora, IL:
| Photo | Address | Area | Beds / Baths | Price | Details |
|---|---|---|---|---|---|

|
#1
Tall Oaks Dr
Aurora, IL 60505
|
685 sq. feet
|
1 baths 1 beds |
$127,000
|
show details |

|
#2
Serendipity Dr
Aurora, IL 60504
|
- sq. feet
|
1 baths 3 beds |
$213,200
|
show details |

|
#3
Pennsylvania Ave
Aurora, IL 60506
|
855 sq. feet
|
1 baths 2 beds |
show details | |

|
#4
Bonner Ave
Aurora, IL 60505
|
748 sq. feet
|
1 baths 2 beds |
show details | |

|
#5
Breckenridge Cir
Aurora, IL 60504
|
2,250 sq. feet
|
2 baths 4 beds |
show details | |

|
#6
N River St
Aurora, IL 60506
|
2,240 sq. feet
|
2 baths 4 beds |
show details | |

|
#7
2nd Ave
Aurora, IL 60505
|
864 sq. feet
|
1 baths 3 beds |
show details | |

|
#8
Foran Ln
Aurora, IL 60506
|
864 sq. feet
|
1 baths 3 beds |
show details | |

|
#9
Laurel Dr
Aurora, IL 60506
|
1,600 sq. feet
|
2 baths 4 beds |
show details | |

|
#10
Aspen Ln
Aurora, IL 60504
|
4,537 sq. feet
|
2 baths 4 beds |
show details |
| Photo | Address | Area | Beds / Baths | Price | Details |
|---|---|---|---|---|---|

|
#11
Winchester Ct W
Aurora, IL 60504
|
1,194 sq. feet
|
1 baths 3 beds |
show details | |

|
#12
Norwood Ln
Aurora, IL 60504
|
1,296 sq. feet
|
1 baths 3 beds |
show details | |

|
#13
Wilshire Ct
Aurora, IL 60502
|
890 sq. feet
|
1 baths 2 beds |
show details | |

|
#14
Ravinia Cir
Aurora, IL 60504
|
1,806 sq. feet
|
1 baths 2 beds |
show details | |

|
#15
Hudson Cir
Aurora, IL 60502
|
1,588 sq. feet
|
2 baths 3 beds |
show details | |

|
#16
Conservatory Ln
Aurora, IL 60502
|
2,019 sq. feet
|
2 baths 2 beds |
show details | |

|
#17
Shadybrook Ln
Aurora, IL 60504
|
1,142 sq. feet
|
1 baths 2 beds |
show details | |

|
#18
Cane Garden Cir
Aurora, IL 60504
|
1,126 sq. feet
|
1 baths 2 beds |
show details | |

|
#19
Belvedere Ln
Aurora, IL 60502
|
1,698 sq. feet
|
1 baths 3 beds |
show details | |

|
#20
Yorkshire Ct
Aurora, IL 60502
|
1,276 sq. feet
|
1 baths 3 beds |
show details |
| Photo | Address | Area | Beds / Baths | Price | Details |
|---|---|---|---|---|---|

|
#21
Stoughton Dr
Aurora, IL 60502
|
1,534 sq. feet
|
2 baths 2 beds |
show details | |

|
#22
Winchester Ct W
Aurora, IL 60504
|
1,159 sq. feet
|
1 baths 3 beds |
show details | |

|
#23
Foxmoor Ln
Aurora, IL 60502
|
1,614 sq. feet
|
2 baths 2 beds |
show details | |

|
#24
Aspen Ln
Aurora, IL 60504
|
3,565 sq. feet
|
2 baths 4 beds |
show details | |

|
#25
Raintree Ct
Aurora, IL 60504
|
1,480 sq. feet
|
1 baths 3 beds |
show details | |

|
#26
Raintree Ct
Aurora, IL 60504
|
1,480 sq. feet
|
1 baths 3 beds |
show details | |

|
#27
Diane Dr
Aurora, IL 60504
|
1,866 sq. feet
|
2 baths 3 beds |
show details | |

|
#28
Hudson Cir
Aurora, IL 60502
|
1,498 sq. feet
|
1 baths 2 beds |
show details | |

|
#29
Prairieview Ln S
Aurora, IL 60502
|
1,276 sq. feet
|
1 baths 3 beds |
show details | |

|
#30
Norwood Ln
Aurora, IL 60504
|
1,228 sq. feet
|
1 baths 3 beds |
show details |
| Photo | Address | Area | Beds / Baths | Price | Details |
|---|---|---|---|---|---|

|
#31
Richland Ln
Aurora, IL 60504
|
1,476 sq. feet
|
1 baths 3 beds |
show details | |

|
#32
Oakland Ln
Aurora, IL 60504
|
1,810 sq. feet
|
2 baths 4 beds |
show details | |

|
#33
Leyland Ln
Aurora, IL 60504
|
828 sq. feet
|
1 baths 2 beds |
show details | |

|
#34
Reflections Dr
Aurora, IL 60502
|
1,404 sq. feet
|
2 baths 2 beds |
show details | |

|
#35
Cerena Ct
Aurora, IL 60504
|
1,500 sq. feet
|
1 baths 3 beds |
show details | |

|
#36
Andover Dr
Aurora, IL 60504
|
1,194 sq. feet
|
1 baths 3 beds |
show details | |

|
#37
Lawrence Ct
Aurora, IL 60504
|
1,480 sq. feet
|
1 baths 3 beds |
show details | |

|
#38
Rosefield Ln
Aurora, IL 60504
|
2,116 sq. feet
|
2 baths 4 beds |
show details | |

|
#39
Camden Ln
Aurora, IL 60504
|
1,746 sq. feet
|
2 baths 4 beds |
show details | |

|
#40
Cove Ct
Aurora, IL 60504
|
1,716 sq. feet
|
2 baths 3 beds |
show details |
| Photo | Address | Area | Beds / Baths | Price | Details |
|---|---|---|---|---|---|

|
#41
Long Grove Ln
Aurora, IL 60504
|
980 sq. feet
|
1 baths 2 beds |
show details | |

|
#42
Brockton Ct
Aurora, IL 60504
|
1,194 sq. feet
|
1 baths 3 beds |
show details | |

|
#43
Bradbury Cir
Aurora, IL 60504
|
1,864 sq. feet
|
2 baths 3 beds |
show details | |

|
#44
Stoughton Cir
Aurora, IL 60502
|
1,668 sq. feet
|
2 baths 3 beds |
show details | |

|
#45
Bridgeport Ln
Aurora, IL 60504
|
1,490 sq. feet
|
1 baths 3 beds |
show details | |

|
#46
Shelly Ln
Aurora, IL 60504
|
944 sq. feet
|
1 baths 2 beds |
show details | |

|
#47
Stoughton Cir
Aurora, IL 60502
|
1,668 sq. feet
|
2 baths 3 beds |
show details | |

|
#48
Devonshire Ct
Aurora, IL 60502
|
1,232 sq. feet
|
1 baths 3 beds |
show details | |

|
#49
Primrose 258
Aurora, IL 60504
|
1,102 sq. feet
|
2 baths 2 beds |
show details | |

|
Check over 1 million property listings on Foreclosure.com!
|
browse all offers | |||

Latest news about housing in Aurora, IL collected exclusively by city-data.com from local newspapers, TV, and radio stations

 | Single family house rental market at Naperville and Aurora (10 replies) |
| Suggestion for apartments in the western suburbs (1 reply) |
| Is is Aurora downtown good to invest in real estate now? (1 reply) |
| Talk to me about Aurora? (45 replies) |
| Apartment hunting with a pitbull (Aurora) (1 reply) |
| River Street Plaza Condos Downtown Aurora??? (16 replies) |

Median year apartment built: 1979
Household type by relationship:
Households: 182,336- Male householders: 35,838 (6,371 living alone), Female householders: 27,643 (7,161 living alone)
30,382 spouses (30,207 opposite-sex spouses), 5,651 unmarried partners, (5,651 opposite-sex unmarried partners), 61,264 children (57,731 natural, 1,086 adopted, 2,447 stepchildren), 4,048 grandchildren, 3,631 brothers or sisters, 4,585 parents, 44 foster children, 3,346 other relatives, 4,474 non-relatives
- In group quarters: 1,430
Size of family households: 15,692 2-persons, 10,627 3-persons, 10,575 4-persons, 4,884 5-persons, 2,880 6-persons, 1,247 7-or-more-persons.
Size of nonfamily households: 13,532 1-person, 3,096 2-persons, 772 3-persons, 176 4-persons.
25,375 married couples with children.
12,737 single-parent households (3,403 men, 9,334 women).
51.3% of residents of Aurora speak English at home.
34.3% of residents speak Spanish at home (63% speak English very well, 20% speak English well, 13% speak English not well, 5% don't speak English at all).
7.5% of residents speak other Indo-European language at home (77% speak English very well, 18% speak English well, 4% speak English not well, 1% don't speak English at all).
5.7% of residents speak Asian or Pacific Island language at home (84% speak English very well, 11% speak English well, 5% speak English not well).
1.2% of residents speak other language at home (87% speak English very well, 13% speak English well).
Foreign born population: 52,016 (28.5%)
(49.1% of them are naturalized citizens)
| Here: | 6.5 |
| State: | 6.4 |
| Here: | 4.2 |
| State: | 4.1 |

- Bedrooms in owner-occupied houses and condos in Aurora, Illinois
- 0no bedroom
- 4511 bedroom
- 10,8982 bedrooms
- 17,7753 bedrooms
- 12,9074 bedrooms
- 1,6205+ bedrooms

- Bedrooms in renter-occupied apartments in Aurora, Illinois
- 466no bedroom
- 6,1321 bedroom
- 7,5682 bedrooms
- 3,6493 bedrooms
- 1,6684 bedrooms
- 3475+ bedrooms

- Cars and other vehicles available in Aurora in owner-occupied houses/condos
- 775no vehicle
- 12,8021 vehicle
- 17,8742 vehicles
- 7,1723 vehicles
- 3,9084 vehicles
- 1,1205+ vehicles

- Cars and other vehicles available in Aurora in renter-occupied apartments
- 2,639no vehicle
- 7,6581 vehicle
- 7,1942 vehicles
- 1,8063 vehicles
- 3384 vehicles
- 1955+ vehicles

- Rooms in owner-occupied houses in Aurora, Illinois
- 01 room
- 892 rooms
- 8163 rooms
- 4,9934 rooms
- 7,9375 rooms
- 8,3756 rooms
- 6,8877 rooms
- 6,7658 rooms
- 7,7899+ rooms

- Rooms in renter-occupied apartments in Aurora, Illinois
- 3861 room
- 1,9232 rooms
- 4,1663 rooms
- 4,9564 rooms
- 3,6405 rooms
- 2,4846 rooms
- 1,1537 rooms
- 3998 rooms
- 7239+ rooms


Aurora, IL household income distribution

- 2,535Less than $10,000
- 3,121$10,000 to $19,999
- 3,236$20,000 to $29,999
- 3,863$30,000 to $39,999
- 3,110$40,000 to $49,999
- 4,575$50,000 to $59,999
- 7,185$60,000 to $74,999
- 9,526$75,000 to $99,999
- 6,553$100,000 to $124,999
- 4,430$125,000 to $149,999
- 6,523$150,000 to $199,999
- 8,824$200,000 or more
Home value of owner - occupied houses in 2022 in Aurora, IL
-
- 241Less than $10,000
- 32$10,000 to $14,999
- 201$15,000 to $19,999
- 72$20,000 to $24,999
- 82$25,000 to $29,999
- 43$30,000 to $34,999
- 63$35,000 to $39,999
- 54$40,000 to $49,999
- 121$50,000 to $59,999
- 67$60,000 to $69,999
- 180$70,000 to $79,999
- 240$80,000 to $89,999
- 417$90,000 to $99,999
- 1,438$100,000 to $124,999
- 1,320$125,000 to $149,999
- 2,529$150,000 to $174,999
- 4,502$175,000 to $199,999
- 7,529$200,000 to $249,999
- 5,869$250,000 to $299,999
- 7,379$300,000 to $399,999
- 4,147$400,000 to $499,999
- 2,538$500,000 to $749,999
- 291$750,000 to $999,999
- 120$1,000,000 to $1,499,999
- 154$2,000,000 or more
Rent paid by renters in 2022 in Aurora, IL
-
- 153Less than $100
- 69$100 to $149
- 140$150 to $199
- 89$200 to $249
- 166$250 to $299
- 243$300 to $349
- 106$350 to $399
- 132$400 to $449
- 89$450 to $499
- 259$500 to $549
- 202$550 to $599
- 158$600 to $649
- 319$650 to $699
- 724$700 to $749
- 467$750 to $799
- 1,586$800 to $899
- 1,482$900 to $999
- 4,364$1,000 to $1,249
- 2,799$1,250 to $1,499
- 4,652$1,500 to $1,999
- 1,198$2,000 to $2,499
- 343$2,500 to $2,999
- 12$3,000 to $3,499
- 70$3,500 or more
- 376No cash rent


Percentage of workers working in this county: 57.5%
Number of people working at home: 15,113 (15.6% of all workers)
Travel time to work (commute)
- Less than 5 minutes: 501
- 5 to 9 minutes: 5,776
- 10 to 14 minutes: 10,820
- 15 to 19 minutes: 12,815
- 20 to 24 minutes: 10,451
- 25 to 29 minutes: 6,318
- 30 to 34 minutes: 14,146
- 35 to 39 minutes: 2,595
- 40 to 44 minutes: 5,320
- 45 to 59 minutes: 5,499
- 60 to 89 minutes: 6,442
- 90 or more minutes: 1,302
Means of transportation to work:
- Drove a car alone: 48,596 (65.9%)
- Carpooled: 8,117 (11.0%)
- Bus: 58 (0.1%)
- Long-distance train or commuter rail: 139 (0.2%)
- Taxi: 792 (1.1%)
- Bicycle: 148 (0.2%)
- Walked: 761 (1.0%)
- Worked at home: 15,113 (20.5%)

- Unemployment by race in 2022
- Unemployment rate for White non-Hispanic residents
- 4.5%Males
- 2.4%Females
- Unemployment rate for Black residents
- 10.7%Males
- 6.6%Females
- Unemployment rate for American Indian and Alaska Native residents
- 3.9%Males
- 2.1%Females
- Unemployment rate for Asian residents
- 2.6%Males
- 2.7%Females
- Unemployment rate for other race residents
- 5.9%Males
- 2.8%Females
- Unemployment rate for two or more race residents
- 8.0%Males
- 2.5%Females
- Unemployment rate for Hispanic or Latino residents
- 7.5%Males
- 2.6%Females

- Year of entry for the foreign-born population in Aurora, Illinois
- 13,5152010 or later
- 10,7182000 to 2009
- 13,5101990 to 1999
- 7,8491980 to 1989
- 4,5511970 to 1979
- 2,070Before 1970

First ancestries reported:
- German: 5,086 (5.3%)
- Italian: 2,306 (2.4%)
- Irish: 2,247 (2.3%)
- American: 2,078 (2.1%)
- Polish: 2,077 (2.1%)
- English: 1,740 (1.8%)
- European: 1,495 (1.5%)
- Romanian: 722 (0.7%)
- Syrian: 702 (0.7%)
- Nigerian: 664 (0.7%)
- African: 558 (0.6%)
- Norwegian: 498 (0.5%)
- Russian: 454 (0.5%)
- Swedish: 393 (0.4%)
- Albanian: 321 (0.3%)
- Bulgarian: 286 (0.3%)
- Ukrainian: 273 (0.3%)
- Greek: 227 (0.2%)
- Scottish: 225 (0.2%)
- Eastern European: 202 (0.2%)
- Jamaican: 179 (0.2%)
- Czech: 170 (0.2%)
- Scotch-Irish: 159 (0.2%)
- Luxembourger: 144 (0.1%)
- Lithuanian: 133 (0.1%)
- French: 133 (0.1%)
- Scandinavian: 133 (0.1%)
- French Canadian: 132 (0.1%)
- Iraqi: 126 (0.1%)
- Croatian: 107 (0.1%)
- Welsh: 102 (0.1%)
- Iranian: 92 (0.10%)
- Dutch: 87 (0.09%)
- Lebanese: 77 (0.08%)
- Hungarian: 65 (0.07%)
- Palestinian: 58 (0.06%)
- Serbian: 53 (0.05%)
- Icelander: 50 (0.05%)
- Afghan: 49 (0.05%)
- Slovak: 49 (0.05%)
- Belgian: 48 (0.05%)
- Northern European: 48 (0.05%)
- Danish: 46 (0.05%)
- British: 44 (0.05%)
- Ethiopian: 37 (0.04%)
- Czechoslovakian: 37 (0.04%)
- Ugandan: 37 (0.04%)
- Cape Verdean: 35 (0.04%)
- Macedonian: 30 (0.03%)
- Slavic: 29 (0.03%)
- Trinidadian and Tobagonian: 28 (0.03%)
- Jordanian: 27 (0.03%)
- Finnish: 27 (0.03%)
- Slovene: 26 (0.03%)
- Canadian: 25 (0.03%)
- Egyptian: 23 (0.02%)
- Turkish: 23 (0.02%)
- Cypriot: 20 (0.02%)
- Yugoslavian: 18 (0.02%)
- Austrian: 16 (0.02%)
- Moroccan: 15 (0.02%)
- Belizean: 13 (0.01%)
- Guyanese: 12 (0.01%)
- Brazilian: 10 (0.01%)
- Estonian: 9 (0.01%)
- Swiss: 8 (0.01%)
Most common places of birth for foreign-born residents (%):
| Aurora: | 54.6% (25,430) |
| Illinois: | 34.7% (626,958) |
| Aurora: | 16.6% (7,703) |
| Illinois: | 9.2% (166,409) |
| Aurora: | 3.4% (1,583) |
| Illinois: | 5.2% (93,003) |
| Aurora: | 2.3% (1,084) |
| Illinois: | 4.1% (74,364) |
| Aurora: | 1.6% (751) |
| Illinois: | 1.6% (29,519) |
Place of birth for U.S.-born residents:
- This state: 101,976
- Other state: 23,792
- Northeast: 2,902
- Midwest: 8,463
- South: 8,197
- West: 4,230
90.6% of Aurora residents lived in the same house 1 years ago.
Out of people who lived in different houses, 32.3% lived in this county.
Out of people who lived in different counties, 84.7% lived in Illinois.
| Aurora: | 90.6% |
| State average: | 88.3% |
Education attainment for males 25 years and older:
- No schooling: 3,549
- Nursery to 4th grade: 334
- 5th and 6th grade: 2,463
- 7th and 8th grade: 1,314
- 9th grade: 640
- 10th grade: 860
- 11th grade: 851
- 12th grade, no diploma: 1,679
- High school graduate (or equivalency): 11,983
- Less than 1 year of college: 3,949
- Some college more than 1 year, no degree: 6,060
- Associate degree: 3,104
- Bachelor's degree: 15,310
- Master's degree: 5,131
- Professional school degree: 477
- Doctorate degree: 767

Education attainment for females 25 years and older:
- No schooling: 2,332
- Nursery to 4th grade: 725
- 5th and 6th grade: 2,375
- 7th and 8th grade: 1,518
- 9th grade: 409
- 10th grade: 1,086
- 11th grade: 1,254
- 12th grade, no diploma: 1,552
- High school graduate (or equivalency): 12,932
- Less than 1 year of college: 3,921
- Some college more than 1 year, no degree: 6,964
- Associate degree: 3,791
- Bachelor's degree: 13,290
- Master's degree: 7,302
- Professional school degree: 570
- Doctorate degree: 606


Housing units in structures:
- One, detached: 40,031
- One, attached: 10,285
- Two: 3,542
- 3 or 4: 3,519
- 5 to 9: 2,676
- 10 to 19: 1,626
- 20 to 49: 1,625
- 50 or more: 2,709
- Mobile homes: 209
- Boats, RVs, vans, etc.: 49
Housing units lacking complete kitchen facilities in 2022: 1.9%
House/condo owner moved in on average 11 years ago
Renter moved in on average 2 years ago

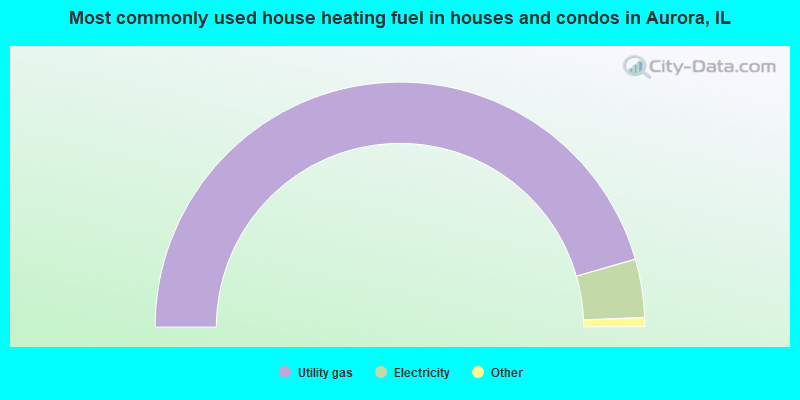
- 91.1%Utility gas
- 7.7%Electricity
- 0.8%Bottled, tank, or LP gas
- 0.3%No fuel used
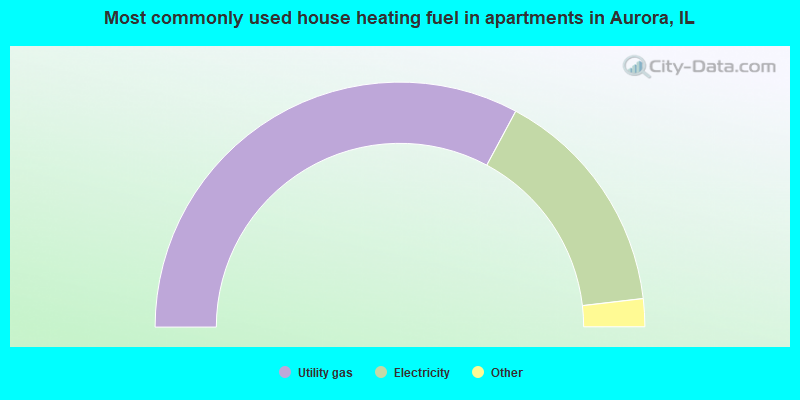
- 65.7%Utility gas
- 30.6%Electricity
- 1.7%No fuel used
- 1.3%Bottled, tank, or LP gas
- 0.7%Other fuel
Private vs. public school enrollment:
| Here: | 4.1% |
| Illinois: | 13.3% |
| Here: | 9.0% |
| Illinois: | 9.9% |
| Here: | 27.8% |
| Illinois: | 27.4% |


