Housing density: 1,059 houses/condos per square mile
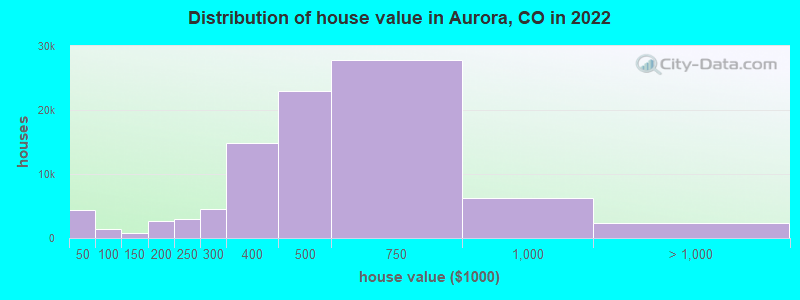
Median price asked for vacant for-sale houses and condos in 2022: $267,535.
Median contract rent in 2022: $1,598 (lower quartile is $1,221, upper quartile is $1,938)
Median rent asked for vacant for-rent units in 2022: $1,410
Median gross rent in Aurora, CO in 2022: $1,725
Housing units in Aurora with a mortgage: 67,851 (8,349 second mortgage, 0 home equity loan, 6,630 both second mortgage and home equity loan) Houses without a mortgage: 716
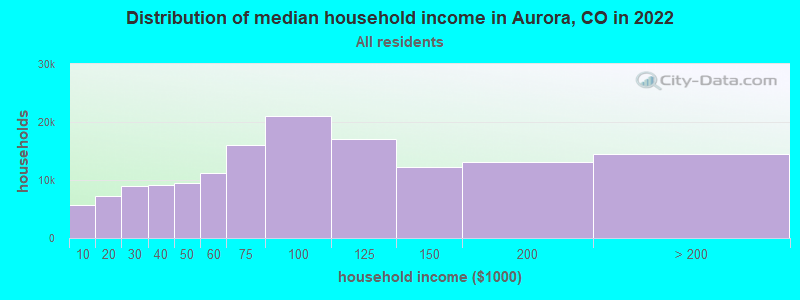
Median household income for houses/condos with a mortgage: $107,971
Median household income for apartments without a mortgage: $70,571
51,825 married couples with children.
27,407 single-parent households (8,284 men, 19,123 women).
68.1% of residents of Aurora speak English at home.
20.8% of residents speak Spanish at home (52% speak English very well, 26% speak English well, 16% speak English not well, 6% don't speak English at all).
4.0% of residents speak other Indo-European language at home (63% speak English very well, 22% speak English well, 14% speak English not well, 1% don't speak English at all).
2.6% of residents speak Asian or Pacific Island language at home (57% speak English very well, 19% speak English well, 23% speak English not well, 2% don't speak English at all).
4.4% of residents speak other language at home (53% speak English very well, 28% speak English well, 14% speak English not well, 5% don't speak English at all).
Foreign born population: 84,040 (21.4%)
(43.3% of them are naturalized citizens)
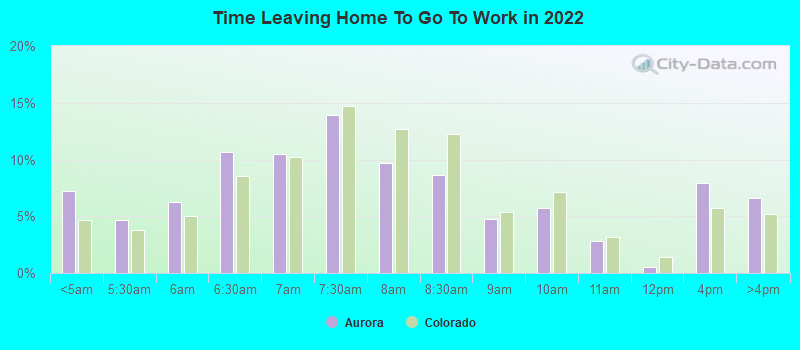
Percentage of workers working in this county: 51.5% Number of people working at home: 33,912 (16.2% of all workers)
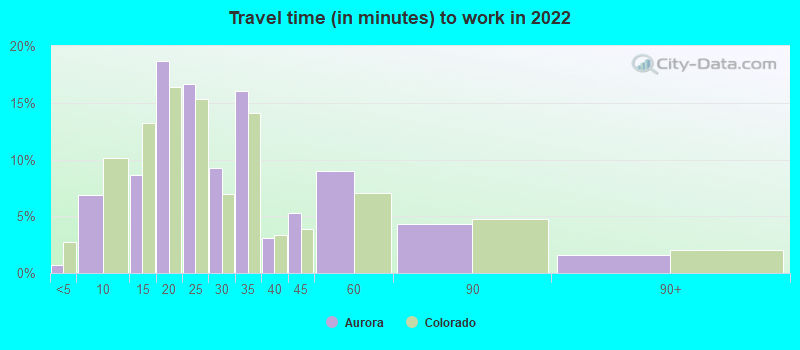
Travel time to work (commute)
Less than 5 minutes: 1,223
5 to 9 minutes: 10,602
10 to 14 minutes: 12,368
15 to 19 minutes: 27,635
20 to 24 minutes: 25,864
25 to 29 minutes: 18,982
30 to 34 minutes: 36,803
35 to 39 minutes: 5,910
40 to 44 minutes: 10,366
45 to 59 minutes: 14,235
60 to 89 minutes: 8,899
90 or more minutes: 3,110
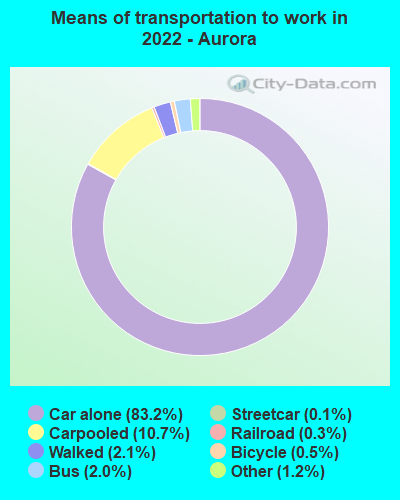
Means of transportation to work:
Drove a car alone: 113,439 (66.6%)
Carpooled: 14,627 (8.6%)
Bus: 2,745 (1.6%)
Subway or elevated rail: 137 (0.1%)
Light rail, streetcar or trolley: 345 (0.2%)
Taxi: 1,601 (0.9%)
Bicycle: 656 (0.4%)
Walked: 2,853 (1.7%)
Worked at home: 33,912 (19.9%)
Unemployment by race in 2022
Unemployment rate for White non-Hispanic residents
4.0%Males
3.3%Females
Unemployment rate for Black residents
5.7%Males
7.6%Females
Unemployment rate for American Indian and Alaska Native residents
4.6%Males
11.8%Females
Unemployment rate for Asian residents
5.4%Males
2.6%Females
Unemployment rate for other race residents
5.1%Males
1.2%Females
Unemployment rate for two or more race residents
7.8%Males
6.8%Females
Unemployment rate for Hispanic or Latino residents
3.7%Males
4.2%Females
Year of entry for the foreign-born population in Aurora, Colorado
29,8142010 or later
21,9452000 to 2009
19,1341990 to 1999
10,4841980 to 1989
4,0401970 to 1979
3,711Before 1970
First ancestries reported:
German: 12,316 (5.9%)
English: 10,082 (4.8%)
American: 9,165 (4.4%)
Ethiopian: 7,585 (3.6%)
Irish: 6,763 (3.3%)
European: 4,997 (2.4%)
Italian: 4,210 (2.0%)
African: 3,758 (1.8%)
Norwegian: 1,800 (0.9%)
Polish: 1,787 (0.9%)
Russian: 1,473 (0.7%)
Scottish: 1,303 (0.6%)
French: 1,183 (0.6%)
Ghanaian: 974 (0.5%)
Dutch: 873 (0.4%)
Palestinian: 843 (0.4%)
Ukrainian: 811 (0.4%)
Scotch-Irish: 811 (0.4%)
Swedish: 731 (0.4%)
Eastern European: 715 (0.3%)
British: 619 (0.3%)
Afghan: 538 (0.3%)
Sudanese: 516 (0.2%)
French Canadian: 493 (0.2%)
Iraqi: 432 (0.2%)
Danish: 415 (0.2%)
Somali: 391 (0.2%)
Bulgarian: 363 (0.2%)
Brazilian: 351 (0.2%)
Czech: 338 (0.2%)
Greek: 338 (0.2%)
Kenyan: 333 (0.2%)
Iranian: 310 (0.1%)
Welsh: 308 (0.1%)
Northern European: 300 (0.1%)
Scandinavian: 289 (0.1%)
Romanian: 285 (0.1%)
Hungarian: 278 (0.1%)
Nigerian: 256 (0.1%)
Canadian: 220 (0.1%)
Moroccan: 214 (0.1%)
Swiss: 138 (0.07%)
Haitian: 136 (0.07%)
Austrian: 129 (0.06%)
Armenian: 127 (0.06%)
Croatian: 120 (0.06%)
Lithuanian: 109 (0.05%)
Ugandan: 100 (0.05%)
Finnish: 93 (0.04%)
Slavic: 82 (0.04%)
Lebanese: 78 (0.04%)
Sierra Leonean: 78 (0.04%)
Liberian: 76 (0.04%)
German Russian: 66 (0.03%)
Serbian: 64 (0.03%)
Yugoslavian: 63 (0.03%)
Portuguese: 63 (0.03%)
West Indian: 62 (0.03%)
Jordanian: 61 (0.03%)
Turkish: 61 (0.03%)
Czechoslovakian: 59 (0.03%)
Egyptian: 56 (0.03%)
Arab: 46 (0.02%)
Australian: 45 (0.02%)
Icelander: 42 (0.02%)
Basque: 41 (0.02%)
Slovak: 35 (0.02%)
Slovene: 33 (0.02%)
Syrian: 31 (0.01%)
Jamaican: 31 (0.01%)
Trinidadian and Tobagonian: 31 (0.01%)
Belgian: 30 (0.01%)
Macedonian: 30 (0.01%)
Guyanese: 21 (0.01%)
Latvian: 17 (0.01%)
Albanian: 17 (0.01%)
Cajun: 15 (0.01%)
Pennsylvania German: 13 (0.01%)
Dutch West Indian: 12 (0.01%)
Most common places of birth for foreign-born residents (%):
Mexico
Aurora:
37.4% (31,013)
Colorado:
38.3% (209,491)
Ethiopia
Aurora:
9.9% (8,183)
Colorado:
1.9% (10,372)
Honduras
Aurora:
3.9% (3,223)
Colorado:
1.1% (6,142)
El Salvador
Aurora:
3.4% (2,860)
Colorado:
2.2% (12,150)
Korea
Aurora:
3.2% (2,684)
Colorado:
2.9% (15,981)
Philippines
Aurora:
2.6% (2,131)
Colorado:
2.3% (12,342)
Vietnam
Aurora:
2.6% (2,128)
Colorado:
3.0% (16,616)
India
Aurora:
2.3% (1,883)
Colorado:
4.0% (21,689)
Ghana
Aurora:
2.1% (1,750)
Colorado:
0.7% (3,596)
Eritrea
Aurora:
1.6% (1,361)
Colorado:
0.4% (2,447)
Place of birth for U.S.-born residents:
This state: 152,796
Other state: 147,654
Northeast: 18,495
Midwest: 43,839
South: 42,139
West: 43,181
83.3% of Aurora residents lived in the same house 1 years ago. Out of people who lived in different houses, 29.3% lived in this county. Out of people who lived in different counties, 61.4% lived in Colorado.
Aurora:
83.3%
State average:
83.6%
Education attainment for males 25 years and older:
No schooling: 2,851
Nursery to 4th grade: 612
5th and 6th grade: 1,176
7th and 8th grade: 2,586
9th grade: 2,488
10th grade: 1,182
11th grade: 1,601
12th grade, no diploma: 3,887
High school graduate (or equivalency): 33,979
Less than 1 year of college: 9,471
Some college more than 1 year, no degree: 15,803
Associate degree: 9,494
Bachelor's degree: 29,774
Master's degree: 9,721
Professional school degree: 2,171
Doctorate degree: 1,314
Education attainment for females 25 years and older:
No schooling: 3,311
Nursery to 4th grade: 529
5th and 6th grade: 2,902
7th and 8th grade: 2,095
9th grade: 1,789
10th grade: 1,274
11th grade: 1,672
12th grade, no diploma: 2,138
High school graduate (or equivalency): 28,273
Less than 1 year of college: 11,130
Some college more than 1 year, no degree: 18,160
Associate degree: 13,662
Bachelor's degree: 28,771
Master's degree: 10,884
Professional school degree: 1,861
Doctorate degree: 2,126
Housing units in structures:
One, detached: 82,158
One, attached: 17,497
Two: 1,672
3 or 4: 4,946
5 to 9: 8,900
10 to 19: 13,459
20 to 49: 7,894
50 or more: 11,983
Mobile homes: 2,127
Boats, RVs, vans, etc.: 284
Median worth of mobile homes: $61,469
Housing units lacking complete plumbing facilities in 2022: 0.3%
Housing units lacking complete kitchen facilities in 2022: 0.4%