Asheville, NC (North Carolina) Houses and Residents
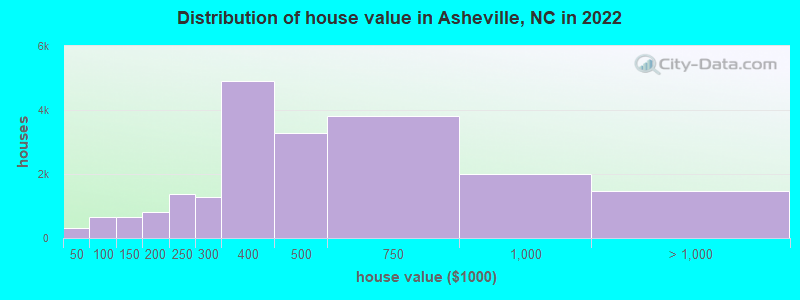
Estimated median house or condo value in 2022: $410,200 (it was $105,200 in 2000 )
Asheville:
$410,200North Carolina:
$280,600
Lower value quartile - upper value quartile: $313,900 - $694,700Mean price in 2022: Detached houses: $534,711 Here:
$534,711State:
$375,326
Townhouses or other attached units: $325,800 Here:
$325,800State:
$317,935
In 2-unit structures: $576,220 Here:
$576,220State:
$250,488
In 3-to-4-unit structures: $505,131 Here:
$505,131State:
$254,939
In 5-or-more-unit structures: $914,664 Here:
$914,664State:
$329,290
Mobile homes: $66,554 Here:
$66,554State:
$124,933
Total population: 87,882 (Urban population: 68,839, Rural population: 113 (all nonfarm) )
Houses: 49,011 (37,410 occupied: 18,816 owner occupied, 18,594 renter occupied )
% of renters here:
50%State:
33%
Housing density: 1,198 houses/condos per square mile
Median price asked for vacant for-sale houses and condos in 2022: $696,090.
Median contract rent in 2022: $1,132 (lower quartile is $815, upper quartile is $1,525)
Median rent asked for vacant for-rent units in 2022: $1,625
Median gross rent in Asheville, NC in 2022: $1,290
Housing units in Asheville with a mortgage: 11,113 (1,162 second mortgage, 0 home equity loan, 1,162 both second mortgage and home equity loan )Houses without a mortgage: 378
Median household income for houses/condos with a mortgage: $112,815
Median household income for apartments without a mortgage: $63,311
Median monthly housing costs: $1,290
Data:
Median house or condo value ($)
Median house or condo value ($ change since 2000)
Median house or condo value ($) - White
Median house or condo value ($) - Black or African American
Median house or condo value ($) - Asian
Median house or condo value ($) - Hispanic or Latino
Median house or condo value ($) - American Indian and Alaska Native
Median house or condo value ($) - Multirace
Median house or condo value ($) - Other Race
Median price asked for mobile homes ($)
Household density (households per square mile)
Mean house or condo value by units in structure - 1, detached ($)
Mean house or condo value by units in structure - 1, attached ($)
Mean house or condo value by units in structure - 2 ($)
Mean house or condo value by units in structure by units in structure - 3 or 4 ($)
Mean house or condo value by units in structure - 5 or more ($)
Mean house or condo value by units in structure - Boat, RV, van, etc. ($)
Mean house or condo value by units in structure - Mobile home ($)
Median contract rent ($)
Median contract rent - Lower quartile ($)
Median contract rent - Upper quartile ($)
Median gross rent ($)
Urban houses (%)
Rural houses (%)
Houses occupied (%)
Houses occupied (% change since 2000)
Houses owner occupied (%)
Houses owner occupied (% change since 2000)
Houses renter occupied (%)
Houses renter occupied (% change since 2000)
Vacant housing units - For rent (%)
Vacant housing units - For rent (% change since 2000)
Vacant housing units - For sale only (%)
Vacant housing units - For sale only (% change since 2000)
Vacant housing units - Rented or sold, not occupied (%)
Vacant housing units - Rented or sold, not occupied (% change since 2000)
Vacant housing units - For seasonal, recreational, or occasional use (%)
Vacant housing units - For seasonal, recreational, or occasional use (% change since 2000)
Vacant housing units - For migrant workers (%)
Vacant housing units - For migrant workers (% change since 2000)
Vacant housing units - Other vacant (%)
Vacant housing units - Other vacant (% change since 2000)
Median monthly housing costs ($)
Median household income for houses/condos with a mortgage ($)
Median household income for houses/condos without a mortgage ($)
Median household income ($)
Median household income ($) - White
Median household income ($) - Black or African American
Median household income ($) - Asian
Median household income ($) - Hispanic or Latino
Median household income ($) - American Indian and Alaska Native
Median household income ($) - Multirace
Median household income ($) - Other Race
Mortgage status - with mortgage (%)
Mortgage status - with second mortgage (%)
Mortgage status - with home equity loan (%)
Mortgage status - with both second mortgage and home equity loan (%)
Mortgage status - without a mortgage (%)
Median year house/condo built
Median year apartment built
Household type by relationship - Male householder living alone (%)
Household type by relationship - Male householder not living alone (%)
Household type by relationship - Female householder living alone (%)
Household type by relationship - Female householder not living alone (%)
Household type by relationship - Opposite-Sex spouse (%)
Household type by relationship - Same-Sex spouse (%)
Household type by relationship - Opposite-Sex unmarried partner (%)
Household type by relationship - Same-Sex unmarried partner (%)
Household type by relationship - In group quarters (%)
Size of family households - 2-person household (%)
Size of family households - 3-person household (%)
Size of family households - 4-person household (%)
Size of family households - 5-person household (%)
Size of family households - 6-person household (%)
Size of family households - 7-or-more-person household (%)
Size of nonfamily households - 1-person household (%)
Size of nonfamily households - 2-person household (%)
Size of nonfamily households - 3-person household (%)
Size of nonfamily households - 4-person household (%)
Size of nonfamily households - 5-person household (%)
Size of nonfamily households - 6-person household (%)
Size of nonfamily households - 7-or-moreperson household (%)
Year house built - Built 2010 or later (%)
Year house built - Built 2000 to 2009 (%)
Year house built - Built 1990 to 1999 (%)
Year house built - Built 1980 to 1989 (%)
Year house built - Built 1970 to 1979 (%)
Year house built - Built 1960 to 1969 (%)
Year house built - Built 1950 to 1959 (%)
Year house built - Built 1940 to 1949 (%)
Year house built - Built 1939 or earlier (%)
Median number of rooms in houses and condos
Median number of rooms in apartments
Median number of bedrooms in owner occupied houses
Mean number of bedrooms in owner occupied houses
Median number of bedrooms in renter occupied houses
Mean number of bedrooms in renter occupied houses
Median number of vehichles in owner occupied houses
Mean number of vehichles in owner occupied houses
Median number of vehichles in renter occupied houses
Mean number of vehichles in renter occupied houses
Rooms in owner-occupied houses - 1 room (%)
Rooms in owner-occupied houses - 2 rooms (%)
Rooms in owner-occupied houses - 3 rooms (%)
Rooms in owner-occupied houses - 4 rooms (%)
Rooms in owner-occupied houses - 5 rooms (%)
Rooms in owner-occupied houses - 6 rooms (%)
Rooms in owner-occupied houses - 7 rooms (%)
Rooms in owner-occupied houses - 8 rooms (%)
Rooms in owner-occupied houses - 9+ rooms (%)
Rooms in renter-occupied houses - 1 room (%)
Rooms in renter-occupied houses - 2 rooms (%)
Rooms in renter-occupied houses - 3 rooms (%)
Rooms in renter-occupied houses - 4 rooms (%)
Rooms in renter-occupied houses - 5 rooms (%)
Rooms in renter-occupied houses - 6 rooms (%)
Rooms in renter-occupied houses - 7 rooms (%)
Rooms in renter-occupied houses - 8 rooms (%)
Rooms in renter-occupied houses - 9+ rooms (%)
Bedrooms in owner-occupied houses - no bedrooms (%)
Bedrooms in owner-occupied houses - 1 bedroom (%)
Bedrooms in owner-occupied houses - 2 bedrooms (%)
Bedrooms in owner-occupied houses - 3 bedrooms (%)
Bedrooms in owner-occupied houses - 4 bedrooms (%)
Bedrooms in owner-occupied houses - 5+ bedrooms (%)
Bedrooms in renter-occupied houses - no bedrooms (%)
Bedrooms in renter-occupied houses - 1 bedroom (%)
Bedrooms in renter-occupied houses - 2 bedrooms (%)
Bedrooms in renter-occupied houses - 3 bedrooms (%)
Bedrooms in renter-occupied houses - 4 bedrooms (%)
Bedrooms in renter-occupied houses - 5+ bedrooms (%)
Vehicles available in owner-occupied houses - no vehicle available (%)
Vehicles available in owner-occupied houses - 1 vehicle available(%)
Vehicles available in owner-occupied houses - 2 Vehicles available (%)
Vehicles available in owner-occupied houses - 3 Vehicles available (%)
Vehicles available in owner-occupied houses - 4 Vehicles available (%)
Vehicles available in owner-occupied houses - 5+ Vehicles available (%)
Vehicles available in renter-occupied houses - no vehicle available (%)
Vehicles available in renter-occupied houses - 1 vehicle available (%)
Vehicles available in renter-occupied houses - 2 Vehicles available (%)
Vehicles available in renter-occupied houses - 3 Vehicles available (%)
Vehicles available in renter-occupied houses - 4 Vehicles available (%)
Vehicles available in renter-occupied houses - 5+ Vehicles available (%)
Housing units in structures - 1, detached (%)
Housing units in structures - 1, attached (%)
Housing units in structures - 2 (%)
Housing units in structures - 3 or 4 (%)
Housing units in structures - 5 to 9 (%)
Housing units in structures - 10 to 19 (%)
Housing units in structures - 20 to 49 (%)
Housing units in structures - 50 or more (%)
Housing units in structures - Mobile home (%)
Housing units in structures - Boat, RV, van, etc. (%)
Housing units in structures - Owners - 1, detached (%)
Housing units in structures - Owners - 1, attached (%)
Housing units in structures - Owners - 2 (%)
Housing units in structures - Owners - 3 or 4 (%)
Housing units in structures - Owners - 5 to 9 (%)
Housing units in structures - Owners - 10 to 19 (%)
Housing units in structures - Owners - 20 to 49 (%)
Housing units in structures - Owners - 50 or more (%)
Housing units in structures - Owners - Mobile home (%)
Housing units in structures - Owners - Boat, RV, van, etc. (%)
Housing units in structures - Renters - 1, detached (%)
Housing units in structures - Renters - 1, attached (%)
Housing units in structures - Renters - 2 (%)
Housing units in structures - Renters - 3 or 4 (%)
Housing units in structures - Renters - 5 to 9 (%)
Housing units in structures - Renters - 10 to 19 (%)
Housing units in structures - Renters - 20 to 49 (%)
Housing units in structures - Renters - 50 or more (%)
Housing units in structures - Renters - Mobile home (%)
Housing units in structures - Renters - Boat, RV, van, etc. (%)
House/condo owner moved in on average (years ago)
Renter moved in on average (years ago)
Year householder moved into unit - Moved in 1999 to March 2000 (%)
Year householder moved into unit - Moved in 1999 to March 2000 (%) - White
Year householder moved into unit - Moved in 1999 to March 2000 (%) - Black or African American
Year householder moved into unit - Moved in 1999 to March 2000 (%) - Asian
Year householder moved into unit - Moved in 1999 to March 2000 (%) - Hispanic or Latino
Year householder moved into unit - Moved in 1999 to March 2000 (%) - American Indian and Alaska Native
Year householder moved into unit - Moved in 1999 to March 2000 (%) - Multirace
Year householder moved into unit - Moved in 1999 to March 2000 (%) - Other Race
Year householder moved into unit - Moved in 1995 to 1998 (%)
Year householder moved into unit - Moved in 1995 to 1998 (%) - White
Year householder moved into unit - Moved in 1995 to 1998 (%) - Black or African American
Year householder moved into unit - Moved in 1995 to 1998 (%) - Asian
Year householder moved into unit - Moved in 1995 to 1998 (%) - Hispanic or Latino
Year householder moved into unit - Moved in 1995 to 1998 (%) - American Indian and Alaska Native
Year householder moved into unit - Moved in 1995 to 1998 (%) - Multirace
Year householder moved into unit - Moved in 1995 to 1998 (%) - Other Race
Year householder moved into unit - Moved in 1990 to 1994 (%)
Year householder moved into unit - Moved in 1990 to 1994 (%) - White
Year householder moved into unit - Moved in 1990 to 1994 (%) - Black or African American
Year householder moved into unit - Moved in 1990 to 1994 (%) - Asian
Year householder moved into unit - Moved in 1990 to 1994 (%) - Hispanic or Latino
Year householder moved into unit - Moved in 1990 to 1994 (%) - American Indian and Alaska Native
Year householder moved into unit - Moved in 1990 to 1994 (%) - Multirace
Year householder moved into unit - Moved in 1990 to 1994 (%) - Other Race
Year householder moved into unit - Moved in 1980 to 1989 (%)
Year householder moved into unit - Moved in 1980 to 1989 (%) - White
Year householder moved into unit - Moved in 1980 to 1989 (%) - Black or African American
Year householder moved into unit - Moved in 1980 to 1989 (%) - Asian
Year householder moved into unit - Moved in 1980 to 1989 (%) - Hispanic or Latino
Year householder moved into unit - Moved in 1980 to 1989 (%) - American Indian and Alaska Native
Year householder moved into unit - Moved in 1980 to 1989 (%) - Multirace
Year householder moved into unit - Moved in 1980 to 1989 (%) - Other Race
Year householder moved into unit - Moved in 1970 to 1979 (%)
Year householder moved into unit - Moved in 1970 to 1979 (%) - White
Year householder moved into unit - Moved in 1970 to 1979 (%) - Black or African American
Year householder moved into unit - Moved in 1970 to 1979 (%) - Asian
Year householder moved into unit - Moved in 1970 to 1979 (%) - Hispanic or Latino
Year householder moved into unit - Moved in 1970 to 1979 (%) - American Indian and Alaska Native
Year householder moved into unit - Moved in 1970 to 1979 (%) - Multirace
Year householder moved into unit - Moved in 1970 to 1979 (%) - Other Race
Year householder moved into unit - Moved in 1969 or earlier (%)
Year householder moved into unit - Moved in 1969 or earlier (%) - White
Year householder moved into unit - Moved in 1969 or earlier (%) - Black or African American
Year householder moved into unit - Moved in 1969 or earlier (%) - Asian
Year householder moved into unit - Moved in 1969 or earlier (%) - Hispanic or Latino
Year householder moved into unit - Moved in 1969 or earlier (%) - American Indian and Alaska Native
Year householder moved into unit - Moved in 1969 or earlier (%) - Multirace
Year householder moved into unit - Moved in 1969 or earlier (%) - Other Race
Housing units lacking complete plumbing facilities (%)
Housing units lacking complete kitchen facilities (%)
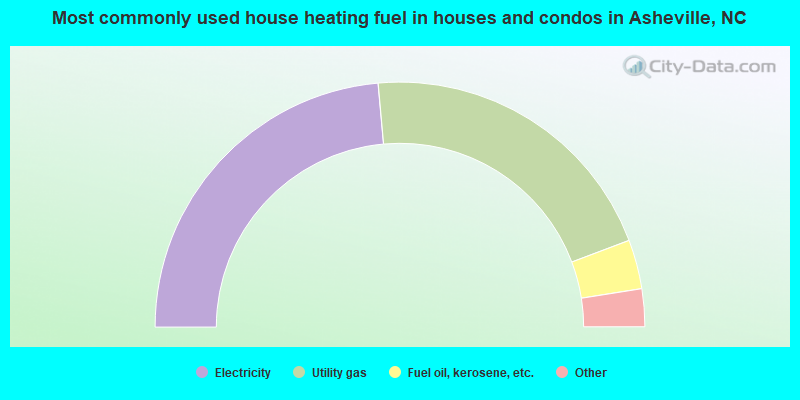
House heating fuel used in houses and condos - Utility gas (%)
House heating fuel used in houses and condos - Bottled, tank, or LP gas (%)
House heating fuel used in houses and condos - Electricity (%)
House heating fuel used in houses and condos - Fuel oil, kerosene, etc. (%)
House heating fuel used in houses and condos - Coal or coke (%)
House heating fuel used in houses and condos - Wood (%)
House heating fuel used in houses and condos - Solar energy (%)
House heating fuel used in houses and condos - Other fuel (%)
House heating fuel used in houses and condos - No fuel used (%)
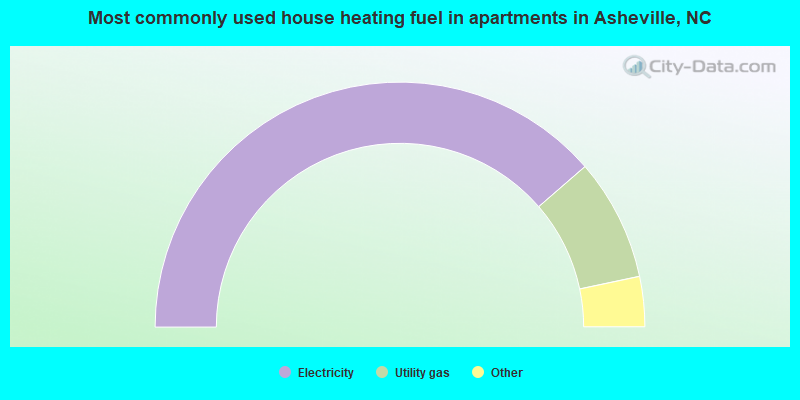
House heating fuel used in apartments - Utility gas (%)
House heating fuel used in apartments - Bottled, tank, or LP gas (%)
House heating fuel used in apartments - Electricity (%)
House heating fuel used in apartments - Fuel oil, kerosene, etc. (%)
House heating fuel used in apartments - Coal or coke (%)
House heating fuel used in apartments - Wood (%)
House heating fuel used in apartments - Solar energy (%)
House heating fuel used in apartments - Other fuel (%)
House heating fuel used in apartments - No fuel used (%)
Latest news about housing in Asheville, NC collected exclusively by city-data.com from local newspapers, TV, and radio stations
Median year house/condo built: 1977Median year apartment built: 1984Household type by relationship:
Households: 93,782
Male householders: 16,744 (4,948 living alone ), Female householders: 20,666 (7,684 living alone )13,376 spouses (13,032 opposite-sex spouses ), 2,933 unmarried partners , (2,623 opposite-sex unmarried partners ), 21,857 children (20,130 natural , 645 adopted , 1,082 stepchildren ), 1,528 grandchildren , 905 brothers or sisters , 1,514 parents , 0 foster children , 2,040 other relatives , 8,596 non-relatives In group quarters: 3,623
Size of family households: 10,478 2-persons , 5,040 3-persons , 2,550 4-persons , 1,422 5-persons , 59 7-or-more-persons .
Size of nonfamily households: 12,632 1-person , 4,984 2-persons , 196 3-persons , 49 4-persons .
6,315 married couples with children. single-parent households (449 men , 6,640 women ).
90.5% of residents of Asheville speak English at home. of residents speak Spanish at home (43% speak English very well , 21% speak English well , 29% speak English not well , 7% don't speak English at all ).of residents speak other Indo-European language at home (58% speak English very well , 12% speak English well , 15% speak English not well , 15% don't speak English at all ).of residents speak Asian or Pacific Island language at home (71% speak English very well , 22% speak English well , 7% speak English not well ).of residents speak other language at home (60% speak English very well , 40% speak English well ).
Foreign born population: 6,413 (6.8%)of them are naturalized citizens )
Median number of rooms in houses and condos:
Median number of rooms in apartments
Owner-occupied Renter-occupied
Bedrooms in owner-occupied houses and condos in Asheville, North Carolina
45 no bedroom 152 1 bedroom 4,240 2 bedrooms 9,197 3 bedrooms 4,060 4 bedrooms 1,122 5+ bedrooms
Bedrooms in renter-occupied apartments in Asheville, North Carolina
1,963 no bedroom 4,050 1 bedroom 7,441 2 bedrooms 4,452 3 bedrooms 566 4 bedrooms 122 5+ bedrooms
Owner-occupied Renter-occupied
Rooms in owner-occupied houses in Asheville, North Carolina
45 1 room 65 2 rooms 508 3 rooms 1,771 4 rooms 3,035 5 rooms 4,081 6 rooms 3,364 7 rooms 2,280 8 rooms 3,667 9+ rooms
Rooms in renter-occupied apartments in Asheville, North Carolina
1,744 1 room 2,085 2 rooms 3,025 3 rooms 4,681 4 rooms 2,650 5 rooms 3,071 6 rooms 417 7 rooms 582 8 rooms 339 9+ rooms
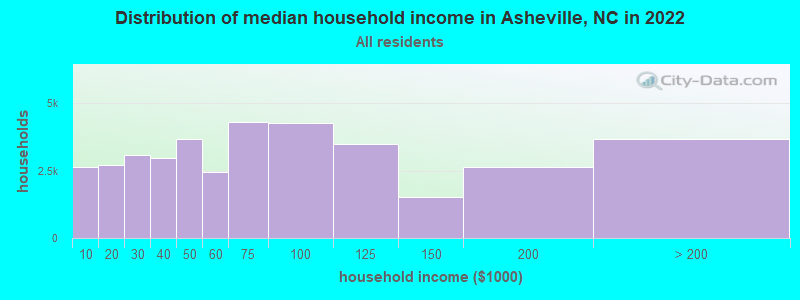
Asheville, NC household income distribution 2,648 Less than $10,0002,705 $10,000 to $19,9993,094 $20,000 to $29,9992,962 $30,000 to $39,9993,676 $40,000 to $49,9992,455 $50,000 to $59,9994,306 $60,000 to $74,9994,255 $75,000 to $99,9993,483 $100,000 to $124,9991,539 $125,000 to $149,9992,621 $150,000 to $199,9993,666 $200,000 or more
Home value of owner - occupied houses in 2022 in Asheville, NC 117 Less than $10,0005 $10,000 to $14,99917 $15,000 to $19,99947 $20,000 to $24,99971 $25,000 to $29,9994 $30,000 to $34,99944 $35,000 to $39,99913 $40,000 to $49,99977 $50,000 to $59,99994 $60,000 to $69,999335 $70,000 to $79,99951 $80,000 to $89,99986 $90,000 to $99,999319 $100,000 to $124,999326 $125,000 to $149,999532 $150,000 to $174,999290 $175,000 to $199,9991,387 $200,000 to $249,9991,287 $250,000 to $299,9994,917 $300,000 to $399,9993,266 $400,000 to $499,9993,802 $500,000 to $749,9991,986 $750,000 to $999,999982 $1,000,000 to $1,499,999254 $1,500,000 to $1,999,999223 $2,000,000 or moreRent paid by renters in 2022 in Asheville, NC 135 $100 to $14992 $150 to $199125 $200 to $249125 $250 to $299618 $300 to $349170 $350 to $3991,212 $400 to $449260 $450 to $49957 $500 to $549237 $550 to $599370 $600 to $64931 $650 to $699243 $700 to $749483 $750 to $7991,896 $800 to $899885 $900 to $9993,712 $1,000 to $1,2492,548 $1,250 to $1,4992,855 $1,500 to $1,9991,323 $2,000 to $2,49943 $2,500 to $2,999370 $3,500 or more804 No cash rent
Percentage of workers working in this county: 92.7%Number of people working at home: 10,615 (22.1% of all workers )
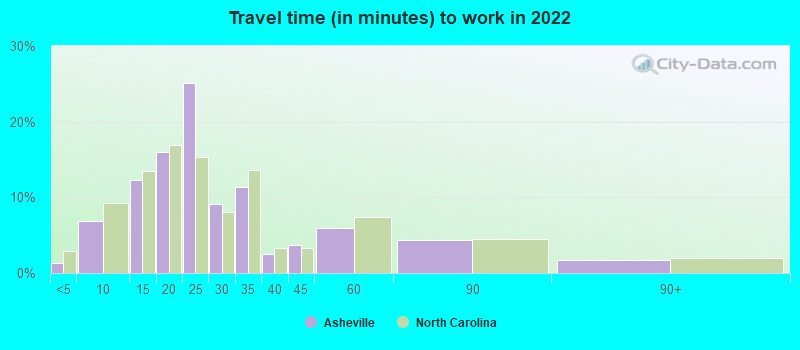
Travel time to work (commute)
Less than 5 minutes: 7195 to 9 minutes: 3,58610 to 14 minutes: 5,47215 to 19 minutes: 8,67820 to 24 minutes: 10,31725 to 29 minutes: 2,84330 to 34 minutes: 2,26135 to 39 minutes: 30540 to 44 minutes: 18345 to 59 minutes: 1,33060 to 89 minutes: 45090 or more minutes: 369
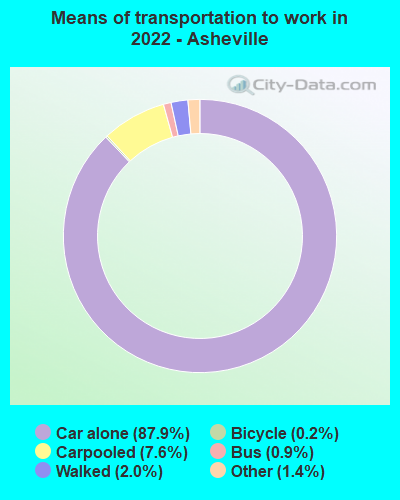
Means of transportation to work:
Drove a car alone: 76,662 (75.4%)Carpooled: 8,923 (8.8%)Bus : 1,081 (1.1%)Ferryboat: 35 (0.0%)Taxi: 695 (0.7%)Bicycle: 230 (0.2%)Walked: 1,808 (1.8%)Worked at home: 10,615 (10.4%)
Unemployment by race in 2022
Unemployment rate for White non-Hispanic residents 3.7% Males1.8% FemalesUnemployment rate for Black residents 10.5% Males3.7% FemalesUnemployment rate for American Indian and Alaska Native residents 35.4% FemalesUnemployment rate for other race residents 1.2% FemalesUnemployment rate for two or more race residents 3.9% Males1.4% FemalesUnemployment rate for Hispanic or Latino residents 3.3% Males0.7% Females
Year of entry for the foreign-born population in Asheville, North Carolina
3,033 2010 or later 2,091 2000 to 2009 964 1990 to 1999 676 1980 to 1989 219 1970 to 1979 652 Before 1970
First ancestries reported:
English: 18,012 (34.1%)
German: 3,011 (5.7%)
American: 2,920 (5.5%)
Irish: 2,808 (5.3%)
Italian: 1,634 (3.1%)
Scotch-Irish: 1,375 (2.6%)
Scottish: 1,363 (2.6%)
French: 1,268 (2.4%)
European: 1,238 (2.3%)
Ukrainian: 822 (1.6%)
Russian: 602 (1.1%)
Polish: 501 (0.9%)
British: 473 (0.9%)
Greek: 459 (0.9%)
Eastern European: 245 (0.5%)
Jamaican: 208 (0.4%)
Swedish: 198 (0.4%)
Lithuanian: 156 (0.3%)
Welsh: 149 (0.3%)
Lebanese: 131 (0.2%)
Romanian: 107 (0.2%)
Dutch: 105 (0.2%)
Norwegian: 94 (0.2%)
Albanian: 90 (0.2%)
Northern European: 82 (0.2%)
Portuguese: 80 (0.2%)
Czech: 79 (0.1%)
Austrian: 74 (0.1%)
French Canadian: 67 (0.1%)
African: 58 (0.1%)
Brazilian: 57 (0.1%)
Scandinavian: 54 (0.1%)
Nigerian: 54 (0.1%)
Danish: 52 (0.10%)
Jordanian: 46 (0.09%)
Swiss: 37 (0.07%)
Finnish: 35 (0.07%)
Palestinian: 33 (0.06%)
Belgian: 27 (0.05%)
Slovene: 24 (0.05%)
South African: 23 (0.04%)
Slovak: 21 (0.04%)
Turkish: 16 (0.03%)
Israeli: 11 (0.02%)
Iranian: 11 (0.02%)
Canadian: 11 (0.02%)
Croatian: 10 (0.02%)
Ethiopian: 10 (0.02%)
Hungarian: 9 (0.02%)
Celtic: 4 (0.01%)
Barbadian: 4 (0.01%)
Bulgarian: 3 (0.01%)
Most common places of birth for foreign-born residents (%): Mexico Asheville:
16.8% (1,272)North Carolina:
24.7% (214,776)
Ukraine Asheville:
8.4% (638)North Carolina:
0.8% (6,645)
Cuba Asheville:
5.7% (431)North Carolina:
1.0% (9,005)
Honduras Asheville:
5.0% (377)North Carolina:
4.7% (40,707)
Canada Asheville:
3.8% (286)North Carolina:
2.1% (18,105)
Venezuela Asheville:
3.3% (246)North Carolina:
1.2% (9,986)
Germany Asheville:
3.2% (239)North Carolina:
1.8% (15,534)
Brazil Asheville:
3.0% (228)North Carolina:
1.0% (8,426)
United Kingdom, excluding England and Scotland Asheville:
3.0% (227)North Carolina:
1.1% (9,831)
Jamaica Asheville:
2.9% (218)North Carolina:
1.3% (11,419)
Philippines Asheville:
2.9% (217)North Carolina:
2.4% (20,695)
China, excluding Hong Kong and Taiwan Asheville:
2.6% (196)North Carolina:
3.2% (27,477)
India Asheville:
2.4% (180)North Carolina:
9.3% (80,594)
Moldova Asheville:
2.3% (172)North Carolina:
0.2% (1,824)
Other Eastern Europe Asheville:
2.2% (168)North Carolina:
0.2% (1,928)
Guatemala Asheville:
1.9% (144)North Carolina:
2.6% (22,964)
Dominican Republic Asheville:
1.7% (131)North Carolina:
1.7% (15,135)
Uzbekistan Asheville:
1.7% (129)North Carolina:
0.1% (639)
Colombia Asheville:
1.7% (128)North Carolina:
2.1% (18,275)
France Asheville:
1.6% (119)North Carolina:
0.4% (3,292)
Place of birth for U.S.-born residents:
This state: 38,697Other state: 47,919Northeast: 13,797Midwest: 10,823South: 19,371West: 3,928 83.4% of Asheville residents lived in the same house 1 years ago.
Out of people who lived in different houses, 25.9% lived in this county.
Out of people who lived in different counties, 50.0% lived in North Carolina.
Asheville:
83.4%State average:
87.3%
Education attainment for males 25 years and older:
No schooling: 145Nursery to 4th grade: 4815th and 6th grade: 07th and 8th grade: 7259th grade: 20810th grade: 74911th grade: 12212th grade, no diploma: 327High school graduate (or equivalency): 6,536Less than 1 year of college: 1,709Some college more than 1 year, no degree: 2,997Associate degree: 1,851Bachelor's degree: 11,058Master's degree: 4,443Professional school degree: 1,494Doctorate degree: 982
Education attainment for females 25 years and older:
No schooling: 583Nursery to 4th grade: 05th and 6th grade: 07th and 8th grade: 09th grade: 78710th grade: 61511th grade: 24812th grade, no diploma: 0High school graduate (or equivalency): 8,411Less than 1 year of college: 1,241Some college more than 1 year, no degree: 2,537Associate degree: 2,759Bachelor's degree: 11,149Master's degree: 8,367Professional school degree: 1,243Doctorate degree: 490
Housing units in structures:
One, detached: 28,224One, attached: 2,538Two: 1,2493 or 4: 1,8965 to 9: 3,99510 to 19: 3,75920 to 49: 2,86450 or more: 3,036Mobile homes: 1,450Median worth of mobile homes: $65,400
Housing units lacking complete plumbing facilities in 2022: 2.0%Housing units lacking complete kitchen facilities in 2022: 5.6%House/condo owner moved in on average 10 years ago
Renter moved in on average 2 years ago
Private vs. public school enrollment:
Students in private schools in grades 1 to 8 (elementary and middle school): 1,101 Here:
15.0%North Carolina:
13.8%
Students in private schools in grades 9 to 12 (high school): 336 Here:
12.7%North Carolina:
11.9%
Students in private undergraduate colleges: 534 Here:
11.1%North Carolina:
19.3%