Jump to a detailed profile or search site with Google Custom Search

Arvada, CO (Colorado) Houses and Residents

Estimated median house or condo value in 2022: $643,600 (it was $173,200 in 2000)
Arvada:

$643,600
Colorado:

$531,100
Lower value quartile - upper value quartile: $513,500 - $799,200

Mean price in 2022:

Detached houses: $658,362
Here:

$658,362
State:

$676,667

Townhouses or other attached units: $531,294
Here:

$531,294
State:

$526,340

In 3-to-4-unit structures: $377,811
Here:

$377,811
State:

$385,502

In 5-or-more-unit structures: $368,681
Here:

$368,681
State:

$417,586

Total population: 113,574 (Urban population: 102,489, Rural population: 16 (11 farm, 5 nonfarm))

Houses: 53,188 (50,537 occupied: 37,650 owner occupied, 12,887 renter occupied)

% of renters here:

26%
State:

34%

Housing density: 1,629 houses/condos per square mile

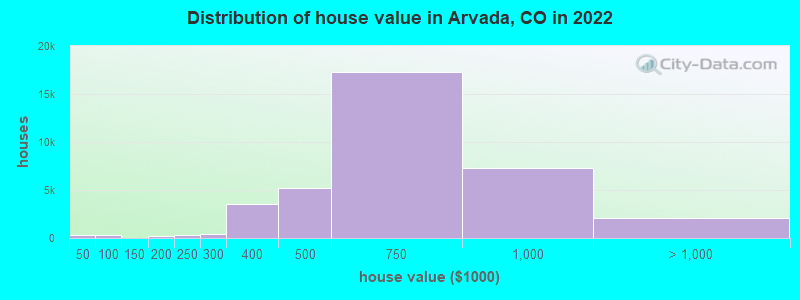
Median price asked for vacant for-sale houses and condos in 2022: $791,224.

Median contract rent in 2022: $1,850 (lower quartile is $1,383, upper quartile is over $2,000)


Median rent asked for vacant for-rent units in 2022: $6,181


Median gross rent in Arvada, CO in 2022: $1,885

Housing units in Arvada with a mortgage: 26,041 (3,286 second mortgage, 116 home equity loan, 3,021 both second mortgage and home equity loan)
Houses without a mortgage: 470

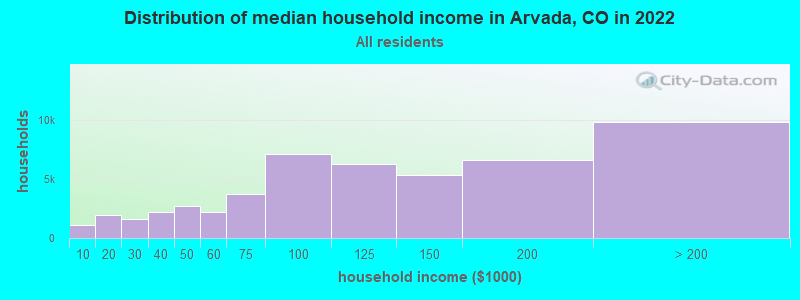
Median household income for houses/condos with a mortgage: $145,444

Median household income for apartments without a mortgage: $86,541

Median monthly housing costs: $1,938

Compare current foreclosures in Arvada, CO:

Check out more offers in Arvada, CO.
Powered by Foreclosure.com

Settings
X
Data:
Loading data...
Based on 2000-2022 data
Loading data...

123
Hide US histogram

Latest news about housing in Arvada, CO collected exclusively by city-data.com from local newspapers, TV, and radio stations

Arvada, Colorado Age and Sex of Residents
Median year house/condo built: 1979

Median year apartment built: 1982

Household type by relationship:

Households: 121,672
  • Male householders: 25,692 (5,136 living alone), Female householders: 24,845 (7,649 living alone)
  • 26,679 spouses (26,319 opposite-sex spouses), 3,703 unmarried partners, (3,253 opposite-sex unmarried partners), 30,239 children (28,776 natural, 743 adopted, 720 stepchildren), 1,269 grandchildren, 800 brothers or sisters, 1,669 parents, 147 foster children, 1,073 other relatives, 4,901 non-relatives
  • In group quarters: 655

Size of family households: 16,745 2-persons, 7,114 3-persons, 5,504 4-persons, 2,721 5-persons, 815 6-persons, 126 7-or-more-persons.

Size of nonfamily households: 12,785 1-person, 3,901 2-persons, 563 3-persons, 136 4-persons, 127 5-persons.

17,654 married couples with children.
4,682 single-parent households (547 men, 4,135 women).

90.5% of residents of Arvada speak English at home.
5.2% of residents speak Spanish at home (80% speak English very well, 12% speak English well, 7% speak English not well, 1% don't speak English at all).
3.0% of residents speak other Indo-European language at home (83% speak English very well, 11% speak English well, 5% speak English not well, 1% don't speak English at all).
1.1% of residents speak Asian or Pacific Island language at home (73% speak English very well, 17% speak English well, 7% speak English not well, 3% don't speak English at all).
0.5% of residents speak other language at home (86% speak English very well, 11% speak English well, 3% speak English not well).

Foreign born population: 7,252 (6.0%)
(67.7% of them are naturalized citizens)

Median number of rooms in houses and condos:
Here:

7.5
State:

6.8

Median number of rooms in apartments
Here:

4.2
State:

4.0

Owner-occupied Renter-occupied
Bedrooms in owner-occupied houses and condos in Arvada, Colorado
  • Bedrooms in owner-occupied houses and condos in Arvada, Colorado
  • 107no bedroom
  • 4461 bedroom
  • 5,9752 bedrooms
  • 12,7623 bedrooms
  • 12,9414 bedrooms
  • 5,4195+ bedrooms
Bedrooms in renter-occupied apartments in Arvada, Colorado
  • Bedrooms in renter-occupied apartments in Arvada, Colorado
  • 625no bedroom
  • 2,3571 bedroom
  • 5,4232 bedrooms
  • 2,8923 bedrooms
  • 1,4474 bedrooms
  • 1435+ bedrooms
Owner-occupied Renter-occupied
Cars and other vehicles available in Arvada in owner-occupied houses/condos
  • Cars and other vehicles available in Arvada in owner-occupied houses/condos
  • 560no vehicle
  • 7,2781 vehicle
  • 17,3412 vehicles
  • 8,2913 vehicles
  • 3,5604 vehicles
  • 6205+ vehicles
Cars and other vehicles available in Arvada in renter-occupied apartments
  • Cars and other vehicles available in Arvada in renter-occupied apartments
  • 1,347no vehicle
  • 5,7991 vehicle
  • 3,6292 vehicles
  • 1,8323 vehicles
  • 2004 vehicles
  • 805+ vehicles
Owner-occupied Renter-occupied
Rooms in owner-occupied houses in Arvada, Colorado
  • Rooms in owner-occupied houses in Arvada, Colorado
  • 1071 room
  • 442 rooms
  • 8663 rooms
  • 2,7444 rooms
  • 3,5135 rooms
  • 5,0826 rooms
  • 6,3247 rooms
  • 7,4658 rooms
  • 11,5059+ rooms
Rooms in renter-occupied apartments in Arvada, Colorado
  • Rooms in renter-occupied apartments in Arvada, Colorado
  • 6251 room
  • 4262 rooms
  • 2,9643 rooms
  • 3,2514 rooms
  • 1,9225 rooms
  • 7656 rooms
  • 1,3127 rooms
  • 8388 rooms
  • 7849+ rooms
Year house built
Median 2022 house/condo value by year built
Median house/condo value by year householder moved into unit
Breakdown of mean house values by ages of householders
Owners and renters by unit type in Arvada, CO
  • Arvada, CO household income distribution

  • Distribution of median household income in Arvada, CO in 2022
  • 1,089Less than $10,000
  • 1,966$10,000 to $19,999
  • 1,622$20,000 to $29,999
  • 2,195$30,000 to $39,999
  • 2,675$40,000 to $49,999
  • 2,189$50,000 to $59,999
  • 3,755$60,000 to $74,999
  • 7,123$75,000 to $99,999
  • 6,226$100,000 to $124,999
  • 5,320$125,000 to $149,999
  • 6,570$150,000 to $199,999
  • 9,807$200,000 or more
  • Home value of owner - occupied houses in 2022 in Arvada, CO

  • Distribution of house value in Arvada, CO in 2022
  • 241Less than $10,000
  • 19$25,000 to $29,999
  • 7$35,000 to $39,999
  • 61$40,000 to $49,999
  • 118$50,000 to $59,999
  • 73$60,000 to $69,999
  • 5$70,000 to $79,999
  • 12$80,000 to $89,999
  • 21$100,000 to $124,999
  • 7$125,000 to $149,999
  • 228$150,000 to $174,999
  • 25$175,000 to $199,999
  • 323$200,000 to $249,999
  • 389$250,000 to $299,999
  • 3,507$300,000 to $399,999
  • 5,232$400,000 to $499,999
  • 17,309$500,000 to $749,999
  • 7,258$750,000 to $999,999
  • 1,732$1,000,000 to $1,499,999
  • 192$1,500,000 to $1,999,999
  • 158$2,000,000 or more
  • Rent paid by renters in 2022 in Arvada, CO

  • Distribution of rent paid by renters in Arvada, CO in 2022
  • 13Less than $100
  • 16$100 to $149
  • 143$200 to $249
  • 46$250 to $299
  • 47$300 to $349
  • 32$400 to $449
  • 74$450 to $499
  • 26$500 to $549
  • 28$550 to $599
  • 60$600 to $649
  • 110$650 to $699
  • 35$700 to $749
  • 18$750 to $799
  • 283$800 to $899
  • 332$900 to $999
  • 1,224$1,000 to $1,249
  • 2,524$1,250 to $1,499
  • 4,170$1,500 to $1,999
  • 2,439$2,000 to $2,499
  • 552$2,500 to $2,999
  • 122$3,000 to $3,499
  • 325$3,500 or more
  • 298No cash rent
Time Leaving Home To Go To Work in 2022

Percentage of workers working in this county: 62.0%
Number of people working at home: 16,683 (24.1% of all workers)

Travel time (in minutes) to work in 2022

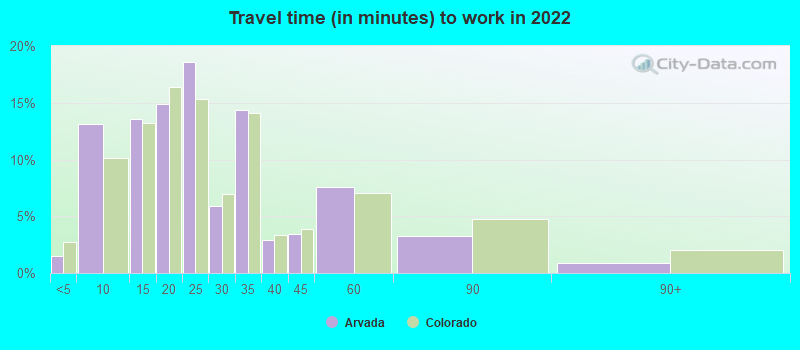
Travel time to work (commute)

  • Less than 5 minutes: 720
  • 5 to 9 minutes: 4,908
  • 10 to 14 minutes: 5,087
  • 15 to 19 minutes: 7,666
  • 20 to 24 minutes: 9,564
  • 25 to 29 minutes: 3,487
  • 30 to 34 minutes: 6,965
  • 35 to 39 minutes: 2,242
  • 40 to 44 minutes: 2,416
  • 45 to 59 minutes: 4,941
  • 60 to 89 minutes: 1,858
  • 90 or more minutes: 629
Means of transportation to work in 2022 - Arvada

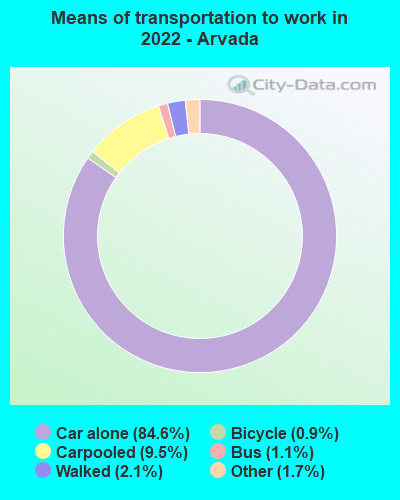
Means of transportation to work:

  • Drove a car alone: 25,720 (55.9%)
  • Carpooled: 2,847 (6.2%)
  • Bus: 373 (0.8%)
  • Light rail, streetcar or trolley: 11 (0.0%)
  • Taxi: 593 (1.3%)
  • Bicycle: 165 (0.4%)
  • Walked: 622 (1.4%)
  • Worked at home: 16,683 (36.2%)
Class of Workers in 2022
  • Unemployment by race in 2022
  • Unemployment rate for White non-Hispanic residents
  • 1.9%Males
  • 2.2%Females
  • Unemployment rate for American Indian and Alaska Native residents
  • 18.6%Males
  • Unemployment rate for Asian residents
  • 4.4%Males
  • 1.1%Females
  • Unemployment rate for other race residents
  • 16.9%Males
  • 7.9%Females
  • Unemployment rate for two or more race residents
  • 3.4%Males
  • 2.4%Females
  • Unemployment rate for Hispanic or Latino residents
  • 11.3%Males
Year of entry for the foreign-born population in Arvada, Colorado
  • Year of entry for the foreign-born population in Arvada, Colorado
  • 1,2062010 or later
  • 1,7872000 to 2009
  • 1,5161990 to 1999
  • 9521980 to 1989
  • 8531970 to 1979
  • 923Before 1970
Ancestries in Arvada, CO

First ancestries reported:

  • German: 7,692 (15.2%)
  • English: 4,593 (9.1%)
  • American: 3,322 (6.6%)
  • Irish: 3,300 (6.5%)
  • Italian: 2,934 (5.8%)
  • European: 2,141 (4.2%)
  • Norwegian: 1,051 (2.1%)
  • Polish: 957 (1.9%)
  • Scottish: 926 (1.8%)
  • Swedish: 840 (1.7%)
  • Dutch: 573 (1.1%)
  • French: 542 (1.1%)
  • Ukrainian: 391 (0.8%)
  • Czech: 365 (0.7%)
  • British: 332 (0.7%)
  • Russian: 320 (0.6%)
  • Scotch-Irish: 295 (0.6%)
  • Welsh: 278 (0.5%)
  • Eastern European: 230 (0.5%)
  • Danish: 225 (0.4%)
  • Northern European: 181 (0.4%)
  • Hungarian: 181 (0.4%)
  • Scandinavian: 131 (0.3%)
  • African: 130 (0.3%)
  • Afghan: 124 (0.2%)
  • Croatian: 122 (0.2%)
  • Lithuanian: 103 (0.2%)
  • French Canadian: 101 (0.2%)
  • Slavic: 96 (0.2%)
  • Iranian: 96 (0.2%)
  • Ethiopian: 91 (0.2%)
  • Finnish: 91 (0.2%)
  • Canadian: 81 (0.2%)
  • Yugoslavian: 69 (0.1%)
  • Romanian: 67 (0.1%)
  • Brazilian: 58 (0.1%)
  • Belgian: 56 (0.1%)
  • Austrian: 54 (0.1%)
  • Swiss: 49 (0.10%)
  • Greek: 38 (0.08%)
  • Serbian: 38 (0.08%)
  • South African: 34 (0.07%)
  • Armenian: 30 (0.06%)
  • Pennsylvania German: 30 (0.06%)
  • Turkish: 30 (0.06%)
  • Jamaican: 26 (0.05%)
  • New Zealander: 22 (0.04%)
  • Lebanese: 22 (0.04%)
  • Syrian: 21 (0.04%)
  • Slovene: 20 (0.04%)
  • Celtic: 17 (0.03%)
  • Portuguese: 17 (0.03%)
  • Slovak: 17 (0.03%)
  • Bulgarian: 16 (0.03%)
  • Moroccan: 15 (0.03%)
  • Czechoslovakian: 13 (0.03%)
  • Egyptian: 11 (0.02%)
  • Australian: 10 (0.02%)
  • Latvian: 9 (0.02%)
  • Basque: 9 (0.02%)
  • Icelander: 8 (0.02%)
  • Arab: 5 (0.01%)
  • Jordanian: 5 (0.01%)
  • Macedonian: 4 (0.01%)

Most common places of birth for foreign-born residents (%):

Mexico
Arvada:

18.7% (1,211)
Colorado:

38.3% (209,491)

India
Arvada:

5.5% (356)
Colorado:

4.0% (21,689)

Ukraine
Arvada:

5.0% (324)
Colorado:

0.8% (4,267)

Germany
Arvada:

4.8% (309)
Colorado:

2.5% (13,706)

Canada
Arvada:

4.5% (290)
Colorado:

2.7% (15,026)

Poland
Arvada:

3.7% (241)
Colorado:

0.9% (4,772)

China, excluding Hong Kong and Taiwan
Arvada:

3.7% (238)
Colorado:

3.3% (17,998)

Philippines
Arvada:

3.7% (238)
Colorado:

2.3% (12,342)

Korea
Arvada:

3.2% (206)
Colorado:

2.9% (15,981)

Vietnam
Arvada:

3.0% (193)
Colorado:

3.0% (16,616)

Russia
Arvada:

2.7% (177)
Colorado:

1.4% (7,860)

Nepal
Arvada:

2.6% (169)
Colorado:

1.0% (5,214)

Ethiopia
Arvada:

2.2% (144)
Colorado:

1.9% (10,372)

Jordan
Arvada:

2.1% (138)
Colorado:

0.1% (792)

Afghanistan
Arvada:

1.8% (118)
Colorado:

0.3% (1,730)

Other Eastern Europe
Arvada:

1.7% (113)
Colorado:

0.4% (1,985)

England
Arvada:

1.7% (110)
Colorado:

1.2% (6,672)

Czechoslovakia (includes Czech Republic and Slovakia)
Arvada:

1.7% (110)
Colorado:

0.3% (1,849)

El Salvador
Arvada:

1.7% (108)
Colorado:

2.2% (12,150)

Brazil
Arvada:

1.6% (102)
Colorado:

1.0% (5,365)

Iran
Arvada:

1.5% (98)
Colorado:

0.7% (3,568)

Place of birth for U.S.-born residents:

  • This state: 55,932
  • Other state: 56,370
  • Northeast: 9,801
  • Midwest: 22,270
  • South: 13,011
  • West: 11,288

87.4% of Arvada residents lived in the same house 1 years ago.
   Out of people who lived in different houses, 29.4% lived in this county.
   Out of people who lived in different counties, 61.3% lived in Colorado.


Arvada:

87.4%
State average:

83.6%

Education attainment for males 25 years and older:

  • No schooling: 205
  • Nursery to 4th grade: 0
  • 5th and 6th grade: 0
  • 7th and 8th grade: 204
  • 9th grade: 166
  • 10th grade: 83
  • 11th grade: 687
  • 12th grade, no diploma: 878
  • High school graduate (or equivalency): 8,927
  • Less than 1 year of college: 2,186
  • Some college more than 1 year, no degree: 5,397
  • Associate degree: 3,335
  • Bachelor's degree: 15,266
  • Master's degree: 6,250
  • Professional school degree: 1,121
  • Doctorate degree: 673
Educational Attainment for Males

Education attainment for females 25 years and older:

  • No schooling: 453
  • Nursery to 4th grade: 0
  • 5th and 6th grade: 0
  • 7th and 8th grade: 107
  • 9th grade: 235
  • 10th grade: 438
  • 11th grade: 133
  • 12th grade, no diploma: 443
  • High school graduate (or equivalency): 8,154
  • Less than 1 year of college: 2,440
  • Some college more than 1 year, no degree: 5,265
  • Associate degree: 2,851
  • Bachelor's degree: 15,617
  • Master's degree: 7,607
  • Professional school degree: 651
  • Doctorate degree: 999
Educational Attainment for Females
Arvada marital status for males
Arvada marital status for females

Housing units in structures:

  • One, detached: 38,133
  • One, attached: 3,657
  • Two: 454
  • 3 or 4: 1,439
  • 5 to 9: 1,889
  • 10 to 19: 3,945
  • 20 to 49: 1,421
  • 50 or more: 2,174
  • Boats, RVs, vans, etc.: 76
Housing units lacking complete plumbing facilities in 2022: 1.3%

Housing units lacking complete kitchen facilities in 2022: 1.7%

House/condo owner moved in on average 9 years ago

Renter moved in on average 2 years ago

Year householders moved into residence in Arvada
Houses and condos Apartments
Most commonly used house heating fuel in houses and condos in Arvada, CO
  • 81.5%Utility gas
  • 17.2%Electricity
  • 0.6%Solar energy
  • 0.6%Bottled, tank, or LP gas
Most commonly used house heating fuel in apartments in Arvada, CO
  • 51.5%Utility gas
  • 44.8%Electricity
  • 1.6%Bottled, tank, or LP gas
  • 1.0%No fuel used
  • 0.7%Other fuel
  • 0.3%Fuel oil, kerosene, etc.
  • 0.2%Solar energy

Private vs. public school enrollment:

Students in private schools in grades 1 to 8 (elementary and middle school): 776
Here:

7.3%
Colorado:

11.4%

Students in private schools in grades 9 to 12 (high school): 748
Here:

13.0%
Colorado:

8.5%

Students in private undergraduate colleges: 747
Here:

16.3%
Colorado:

14.0%
School Enrollment by Level of School for Male Students
School Enrollment by Level of School for Female Students
Age and Sex of Sensory-Disabled Noninstitutionalized Residents
Age and Sex of Physically-Disabled Noninstitutionalized Residents
Age and Sex of Mentally-Disabled Noninstitutionalized Residents
Age and Sex of Self-Care Disabled Noninstitutionalized Residents
Age and Sex of Go-Outside-Home Disabled Noninstitutionalized Residents
Age and Sex of Noninstitutionalized Residents with Employment Disability