Ancient Oaks, PA (Pennsylvania) Houses and Residents
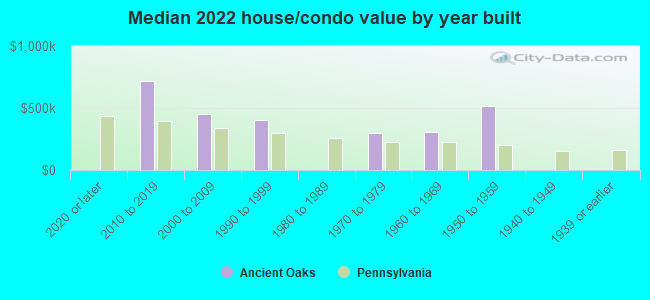
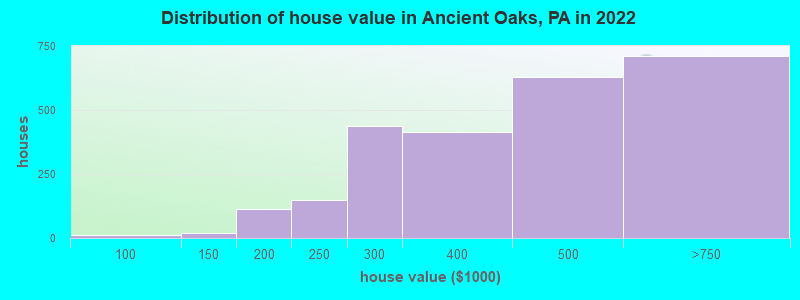
Estimated median house or condo value in 2022: $435,635 (it was $136,500 in 2000 )
Ancient Oaks:
$435,635Pennsylvania:
$245,500
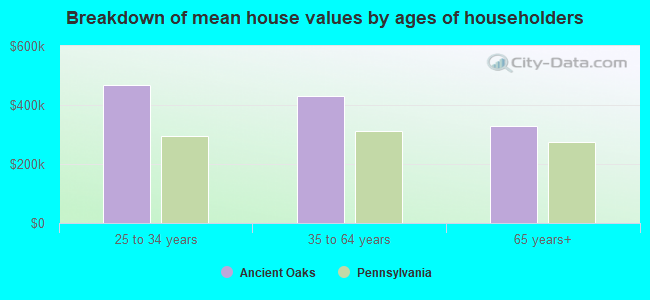
Lower value quartile - upper value quartile: $322,588 - $539,962Mean price in 2022: Detached houses: $434,635 Here:
$434,635State:
$317,202
Townhouses or other attached units: $265,996 Here:
$265,996State:
$254,369
In 5-or-more-unit structures: $103,318 Here:
$103,318State:
$320,068
Total population: 6,661 (Urban population: 3,194, Rural population: 0)
Houses: 2,631 (2,528 occupied: 2,068 owner occupied, 451 renter occupied )
% of renters here:
18%State:
31%
Housing density: 1,199 houses/condos per square mile
Median price asked for vacant for-sale houses and condos in 2022 in this county: $258,893.
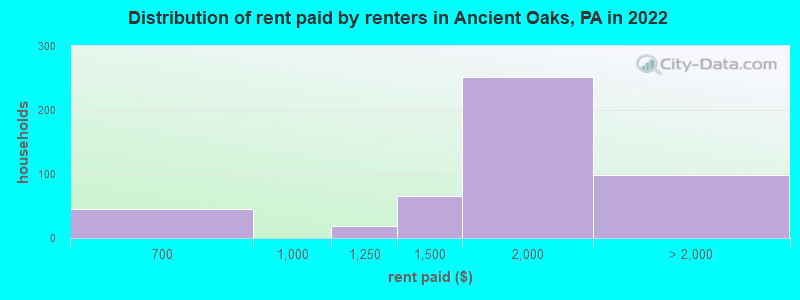
Median contract rent in 2022: $1,622 (lower quartile is $1,382, upper quartile is $1,852)
Median rent asked for vacant for-rent units in 2022: $1,793
Median gross rent in Ancient Oaks, PA in 2022: $1,724
Housing units in Ancient Oaks with a mortgage: 1,482 (316 second mortgage, 88 home equity loan, 272 both second mortgage and home equity loan )Houses without a mortgage: 84
Median household income for houses/condos with a mortgage: $159,173
Median household income for apartments without a mortgage: $110,564
Median monthly housing costs: $1,769
Data:
Median house or condo value ($)
Median house or condo value ($ change since 2000)
Median house or condo value ($) - White
Median house or condo value ($) - Black or African American
Median house or condo value ($) - Asian
Median house or condo value ($) - Hispanic or Latino
Median house or condo value ($) - American Indian and Alaska Native
Median house or condo value ($) - Multirace
Median house or condo value ($) - Other Race
Median price asked for mobile homes ($)
Household density (households per square mile)
Mean house or condo value by units in structure - 1, detached ($)
Mean house or condo value by units in structure - 1, attached ($)
Mean house or condo value by units in structure - 2 ($)
Mean house or condo value by units in structure by units in structure - 3 or 4 ($)
Mean house or condo value by units in structure - 5 or more ($)
Mean house or condo value by units in structure - Boat, RV, van, etc. ($)
Mean house or condo value by units in structure - Mobile home ($)
Median contract rent ($)
Median contract rent - Lower quartile ($)
Median contract rent - Upper quartile ($)
Median gross rent ($)
Urban houses (%)
Rural houses (%)
Houses occupied (%)
Houses occupied (% change since 2000)
Houses owner occupied (%)
Houses owner occupied (% change since 2000)
Houses renter occupied (%)
Houses renter occupied (% change since 2000)
Vacant housing units - For rent (%)
Vacant housing units - For rent (% change since 2000)
Vacant housing units - For sale only (%)
Vacant housing units - For sale only (% change since 2000)
Vacant housing units - Rented or sold, not occupied (%)
Vacant housing units - Rented or sold, not occupied (% change since 2000)
Vacant housing units - For seasonal, recreational, or occasional use (%)
Vacant housing units - For seasonal, recreational, or occasional use (% change since 2000)
Vacant housing units - For migrant workers (%)
Vacant housing units - For migrant workers (% change since 2000)
Vacant housing units - Other vacant (%)
Vacant housing units - Other vacant (% change since 2000)
Median monthly housing costs ($)
Median household income for houses/condos with a mortgage ($)
Median household income for houses/condos without a mortgage ($)
Median household income ($)
Median household income ($) - White
Median household income ($) - Black or African American
Median household income ($) - Asian
Median household income ($) - Hispanic or Latino
Median household income ($) - American Indian and Alaska Native
Median household income ($) - Multirace
Median household income ($) - Other Race
Mortgage status - with mortgage (%)
Mortgage status - with second mortgage (%)
Mortgage status - with home equity loan (%)
Mortgage status - with both second mortgage and home equity loan (%)
Mortgage status - without a mortgage (%)
Median year house/condo built
Median year apartment built
Household type by relationship - Male householder living alone (%)
Household type by relationship - Male householder not living alone (%)
Household type by relationship - Female householder living alone (%)
Household type by relationship - Female householder not living alone (%)
Household type by relationship - Opposite-Sex spouse (%)
Household type by relationship - Same-Sex spouse (%)
Household type by relationship - Opposite-Sex unmarried partner (%)
Household type by relationship - Same-Sex unmarried partner (%)
Household type by relationship - In group quarters (%)
Size of family households - 2-person household (%)
Size of family households - 3-person household (%)
Size of family households - 4-person household (%)
Size of family households - 5-person household (%)
Size of family households - 6-person household (%)
Size of family households - 7-or-more-person household (%)
Size of nonfamily households - 1-person household (%)
Size of nonfamily households - 2-person household (%)
Size of nonfamily households - 3-person household (%)
Size of nonfamily households - 4-person household (%)
Size of nonfamily households - 5-person household (%)
Size of nonfamily households - 6-person household (%)
Size of nonfamily households - 7-or-moreperson household (%)
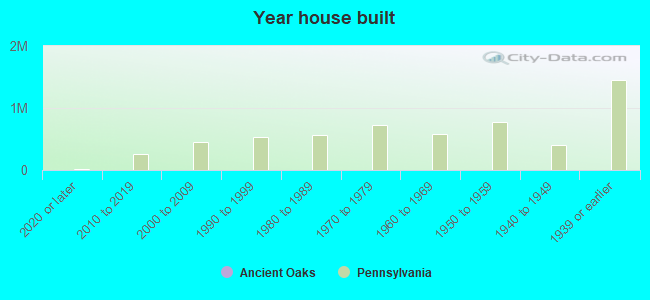
Year house built - Built 2010 or later (%)
Year house built - Built 2000 to 2009 (%)
Year house built - Built 1990 to 1999 (%)
Year house built - Built 1980 to 1989 (%)
Year house built - Built 1970 to 1979 (%)
Year house built - Built 1960 to 1969 (%)
Year house built - Built 1950 to 1959 (%)
Year house built - Built 1940 to 1949 (%)
Year house built - Built 1939 or earlier (%)
Median number of rooms in houses and condos
Median number of rooms in apartments
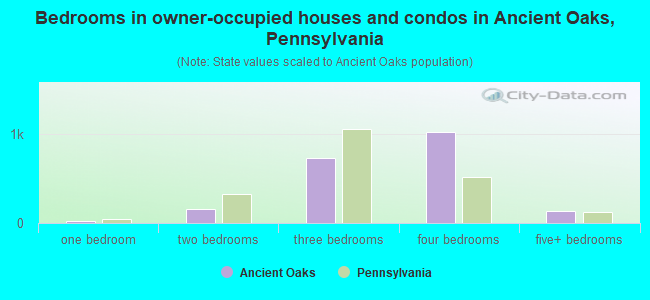
Median number of bedrooms in owner occupied houses
Mean number of bedrooms in owner occupied houses
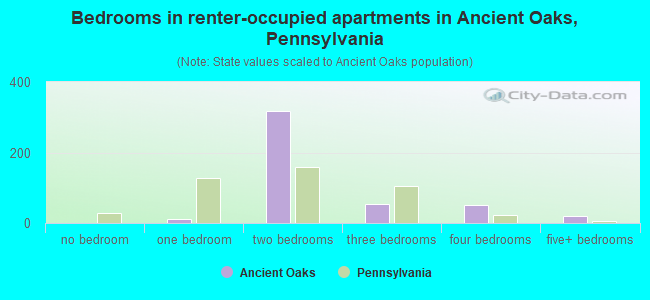
Median number of bedrooms in renter occupied houses
Mean number of bedrooms in renter occupied houses
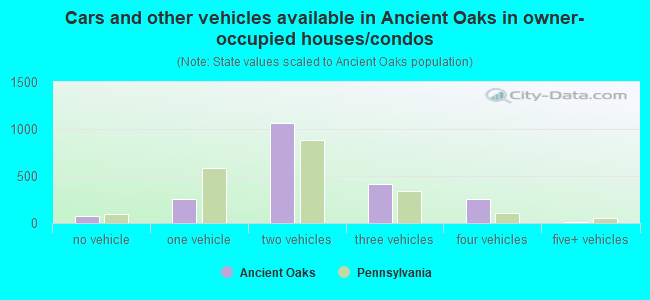
Median number of vehichles in owner occupied houses
Mean number of vehichles in owner occupied houses
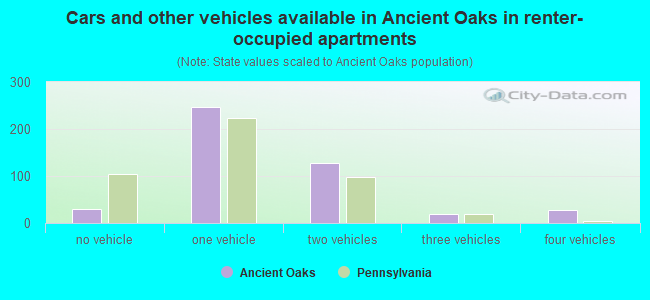
Median number of vehichles in renter occupied houses
Mean number of vehichles in renter occupied houses
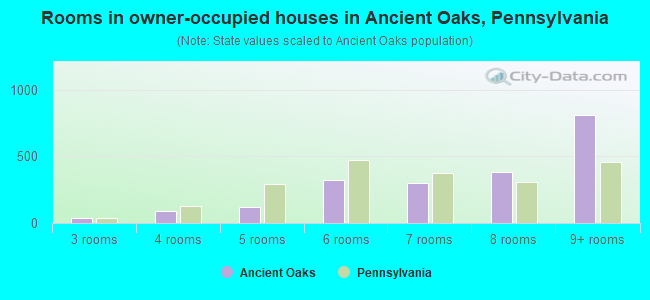
Rooms in owner-occupied houses - 1 room (%)
Rooms in owner-occupied houses - 2 rooms (%)
Rooms in owner-occupied houses - 3 rooms (%)
Rooms in owner-occupied houses - 4 rooms (%)
Rooms in owner-occupied houses - 5 rooms (%)
Rooms in owner-occupied houses - 6 rooms (%)
Rooms in owner-occupied houses - 7 rooms (%)
Rooms in owner-occupied houses - 8 rooms (%)
Rooms in owner-occupied houses - 9+ rooms (%)
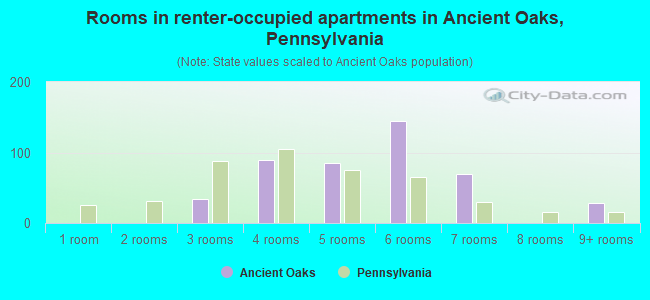
Rooms in renter-occupied houses - 1 room (%)
Rooms in renter-occupied houses - 2 rooms (%)
Rooms in renter-occupied houses - 3 rooms (%)
Rooms in renter-occupied houses - 4 rooms (%)
Rooms in renter-occupied houses - 5 rooms (%)
Rooms in renter-occupied houses - 6 rooms (%)
Rooms in renter-occupied houses - 7 rooms (%)
Rooms in renter-occupied houses - 8 rooms (%)
Rooms in renter-occupied houses - 9+ rooms (%)
Bedrooms in owner-occupied houses - no bedrooms (%)
Bedrooms in owner-occupied houses - 1 bedroom (%)
Bedrooms in owner-occupied houses - 2 bedrooms (%)
Bedrooms in owner-occupied houses - 3 bedrooms (%)
Bedrooms in owner-occupied houses - 4 bedrooms (%)
Bedrooms in owner-occupied houses - 5+ bedrooms (%)
Bedrooms in renter-occupied houses - no bedrooms (%)
Bedrooms in renter-occupied houses - 1 bedroom (%)
Bedrooms in renter-occupied houses - 2 bedrooms (%)
Bedrooms in renter-occupied houses - 3 bedrooms (%)
Bedrooms in renter-occupied houses - 4 bedrooms (%)
Bedrooms in renter-occupied houses - 5+ bedrooms (%)
Vehicles available in owner-occupied houses - no vehicle available (%)
Vehicles available in owner-occupied houses - 1 vehicle available(%)
Vehicles available in owner-occupied houses - 2 Vehicles available (%)
Vehicles available in owner-occupied houses - 3 Vehicles available (%)
Vehicles available in owner-occupied houses - 4 Vehicles available (%)
Vehicles available in owner-occupied houses - 5+ Vehicles available (%)
Vehicles available in renter-occupied houses - no vehicle available (%)
Vehicles available in renter-occupied houses - 1 vehicle available (%)
Vehicles available in renter-occupied houses - 2 Vehicles available (%)
Vehicles available in renter-occupied houses - 3 Vehicles available (%)
Vehicles available in renter-occupied houses - 4 Vehicles available (%)
Vehicles available in renter-occupied houses - 5+ Vehicles available (%)
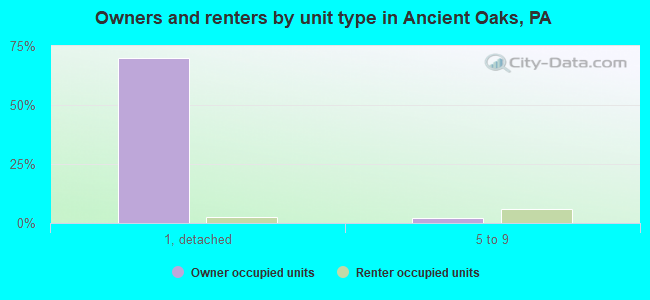
Housing units in structures - 1, detached (%)
Housing units in structures - 1, attached (%)
Housing units in structures - 2 (%)
Housing units in structures - 3 or 4 (%)
Housing units in structures - 5 to 9 (%)
Housing units in structures - 10 to 19 (%)
Housing units in structures - 20 to 49 (%)
Housing units in structures - 50 or more (%)
Housing units in structures - Mobile home (%)
Housing units in structures - Boat, RV, van, etc. (%)
Housing units in structures - Owners - 1, detached (%)
Housing units in structures - Owners - 1, attached (%)
Housing units in structures - Owners - 2 (%)
Housing units in structures - Owners - 3 or 4 (%)
Housing units in structures - Owners - 5 to 9 (%)
Housing units in structures - Owners - 10 to 19 (%)
Housing units in structures - Owners - 20 to 49 (%)
Housing units in structures - Owners - 50 or more (%)
Housing units in structures - Owners - Mobile home (%)
Housing units in structures - Owners - Boat, RV, van, etc. (%)
Housing units in structures - Renters - 1, detached (%)
Housing units in structures - Renters - 1, attached (%)
Housing units in structures - Renters - 2 (%)
Housing units in structures - Renters - 3 or 4 (%)
Housing units in structures - Renters - 5 to 9 (%)
Housing units in structures - Renters - 10 to 19 (%)
Housing units in structures - Renters - 20 to 49 (%)
Housing units in structures - Renters - 50 or more (%)
Housing units in structures - Renters - Mobile home (%)
Housing units in structures - Renters - Boat, RV, van, etc. (%)
House/condo owner moved in on average (years ago)
Renter moved in on average (years ago)
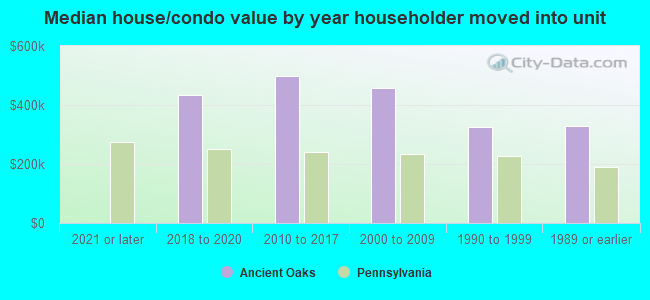
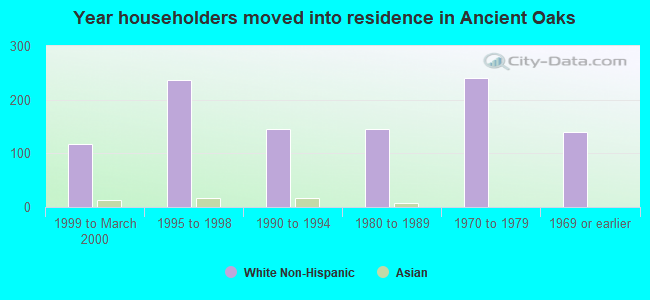
Year householder moved into unit - Moved in 1999 to March 2000 (%)
Year householder moved into unit - Moved in 1999 to March 2000 (%) - White
Year householder moved into unit - Moved in 1999 to March 2000 (%) - Black or African American
Year householder moved into unit - Moved in 1999 to March 2000 (%) - Asian
Year householder moved into unit - Moved in 1999 to March 2000 (%) - Hispanic or Latino
Year householder moved into unit - Moved in 1999 to March 2000 (%) - American Indian and Alaska Native
Year householder moved into unit - Moved in 1999 to March 2000 (%) - Multirace
Year householder moved into unit - Moved in 1999 to March 2000 (%) - Other Race
Year householder moved into unit - Moved in 1995 to 1998 (%)
Year householder moved into unit - Moved in 1995 to 1998 (%) - White
Year householder moved into unit - Moved in 1995 to 1998 (%) - Black or African American
Year householder moved into unit - Moved in 1995 to 1998 (%) - Asian
Year householder moved into unit - Moved in 1995 to 1998 (%) - Hispanic or Latino
Year householder moved into unit - Moved in 1995 to 1998 (%) - American Indian and Alaska Native
Year householder moved into unit - Moved in 1995 to 1998 (%) - Multirace
Year householder moved into unit - Moved in 1995 to 1998 (%) - Other Race
Year householder moved into unit - Moved in 1990 to 1994 (%)
Year householder moved into unit - Moved in 1990 to 1994 (%) - White
Year householder moved into unit - Moved in 1990 to 1994 (%) - Black or African American
Year householder moved into unit - Moved in 1990 to 1994 (%) - Asian
Year householder moved into unit - Moved in 1990 to 1994 (%) - Hispanic or Latino
Year householder moved into unit - Moved in 1990 to 1994 (%) - American Indian and Alaska Native
Year householder moved into unit - Moved in 1990 to 1994 (%) - Multirace
Year householder moved into unit - Moved in 1990 to 1994 (%) - Other Race
Year householder moved into unit - Moved in 1980 to 1989 (%)
Year householder moved into unit - Moved in 1980 to 1989 (%) - White
Year householder moved into unit - Moved in 1980 to 1989 (%) - Black or African American
Year householder moved into unit - Moved in 1980 to 1989 (%) - Asian
Year householder moved into unit - Moved in 1980 to 1989 (%) - Hispanic or Latino
Year householder moved into unit - Moved in 1980 to 1989 (%) - American Indian and Alaska Native
Year householder moved into unit - Moved in 1980 to 1989 (%) - Multirace
Year householder moved into unit - Moved in 1980 to 1989 (%) - Other Race
Year householder moved into unit - Moved in 1970 to 1979 (%)
Year householder moved into unit - Moved in 1970 to 1979 (%) - White
Year householder moved into unit - Moved in 1970 to 1979 (%) - Black or African American
Year householder moved into unit - Moved in 1970 to 1979 (%) - Asian
Year householder moved into unit - Moved in 1970 to 1979 (%) - Hispanic or Latino
Year householder moved into unit - Moved in 1970 to 1979 (%) - American Indian and Alaska Native
Year householder moved into unit - Moved in 1970 to 1979 (%) - Multirace
Year householder moved into unit - Moved in 1970 to 1979 (%) - Other Race
Year householder moved into unit - Moved in 1969 or earlier (%)
Year householder moved into unit - Moved in 1969 or earlier (%) - White
Year householder moved into unit - Moved in 1969 or earlier (%) - Black or African American
Year householder moved into unit - Moved in 1969 or earlier (%) - Asian
Year householder moved into unit - Moved in 1969 or earlier (%) - Hispanic or Latino
Year householder moved into unit - Moved in 1969 or earlier (%) - American Indian and Alaska Native
Year householder moved into unit - Moved in 1969 or earlier (%) - Multirace
Year householder moved into unit - Moved in 1969 or earlier (%) - Other Race
Housing units lacking complete plumbing facilities (%)
Housing units lacking complete kitchen facilities (%)
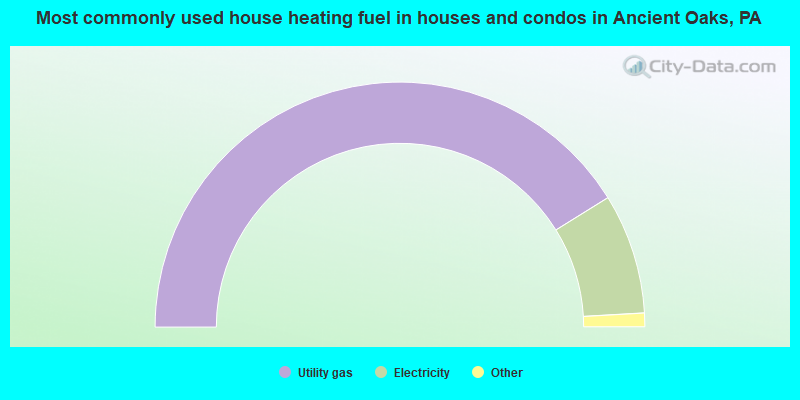
House heating fuel used in houses and condos - Utility gas (%)
House heating fuel used in houses and condos - Bottled, tank, or LP gas (%)
House heating fuel used in houses and condos - Electricity (%)
House heating fuel used in houses and condos - Fuel oil, kerosene, etc. (%)
House heating fuel used in houses and condos - Coal or coke (%)
House heating fuel used in houses and condos - Wood (%)
House heating fuel used in houses and condos - Solar energy (%)
House heating fuel used in houses and condos - Other fuel (%)
House heating fuel used in houses and condos - No fuel used (%)
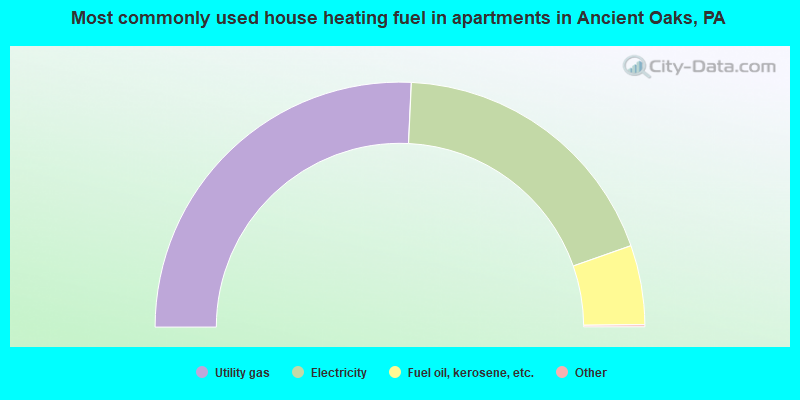
House heating fuel used in apartments - Utility gas (%)
House heating fuel used in apartments - Bottled, tank, or LP gas (%)
House heating fuel used in apartments - Electricity (%)
House heating fuel used in apartments - Fuel oil, kerosene, etc. (%)
House heating fuel used in apartments - Coal or coke (%)
House heating fuel used in apartments - Wood (%)
House heating fuel used in apartments - Solar energy (%)
House heating fuel used in apartments - Other fuel (%)
House heating fuel used in apartments - No fuel used (%)
Median year house/condo built: 2000Median year apartment built: 1999Household type by relationship:
Households: 7,406
Male householders: 1,531 (163 living alone ), Female householders: 987 (218 living alone )1,847 spouses (1,805 opposite-sex spouses ), 52 unmarried partners , (41 opposite-sex unmarried partners ), 2,427 children (2,269 natural , 67 adopted , 90 stepchildren ), 284 grandchildren , 24 brothers or sisters , 21 parents , 7 foster children , 32 other relatives , 182 non-relatives In group quarters: 8
Size of family households: 933 2-persons , 339 3-persons , 366 4-persons , 253 5-persons , 42 6-persons , 75 7-or-more-persons .
Size of nonfamily households: 400 1-person , 51 2-persons , 52 4-persons .
1,790 married couples with children. single-parent households (92 men , 44 women ).
78.6% of residents of Ancient Oaks speak English at home. of residents speak Spanish at home (79% speak English very well , 21% speak English well ).of residents speak other Indo-European language at home (95% speak English very well , 2% speak English not well , 3% don't speak English at all ).of residents speak Asian or Pacific Island language at home (60% speak English very well , 31% speak English well , 7% speak English not well , 2% don't speak English at all ).of residents speak other language at home (92% speak English very well , 5% speak English well , 3% speak English not well ).
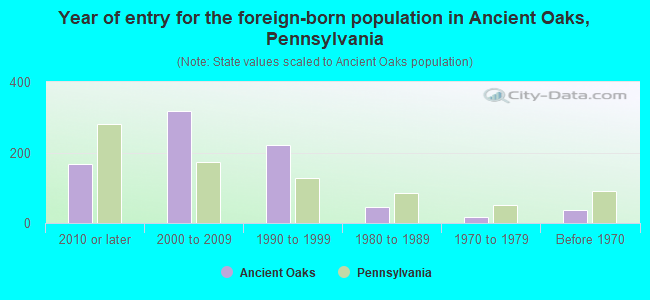
Foreign born population: 1,185 (16.0%)of them are naturalized citizens )
Median number of rooms in houses and condos:
Median number of rooms in apartments
Ancient Oaks, PA household income distribution 76 Less than $10,00041 $10,000 to $19,999126 $20,000 to $29,99987 $30,000 to $39,99969 $40,000 to $49,99942 $50,000 to $59,999241 $60,000 to $74,999351 $75,000 to $99,999212 $100,000 to $124,999133 $125,000 to $149,999316 $150,000 to $199,999872 $200,000 or more
Home value of owner - occupied houses in 2022 in Ancient Oaks, PA 9 $70,000 to $79,99919 $125,000 to $149,99937 $150,000 to $174,99976 $175,000 to $199,999147 $200,000 to $249,999437 $250,000 to $299,999414 $300,000 to $399,999626 $400,000 to $499,999709 $500,000 to $749,999Rent paid by renters in 2022 in Ancient Oaks, PA 0 $450 to $49946 $600 to $64918 $1,000 to $1,24964 $1,250 to $1,499252 $1,500 to $1,99928 $3,000 to $3,49970 No cash rent
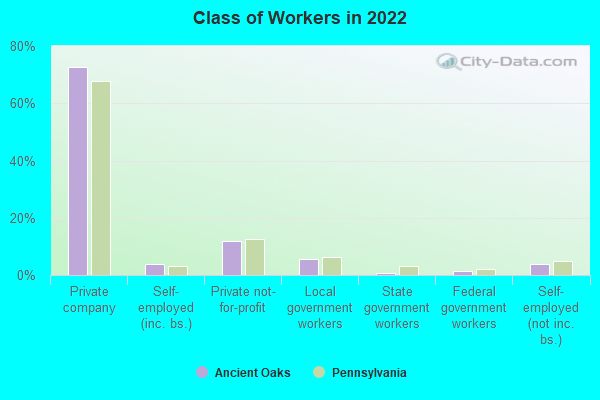
Percentage of workers working in this county: 78.4%Number of people working at home: 888 (23.8% of all workers )
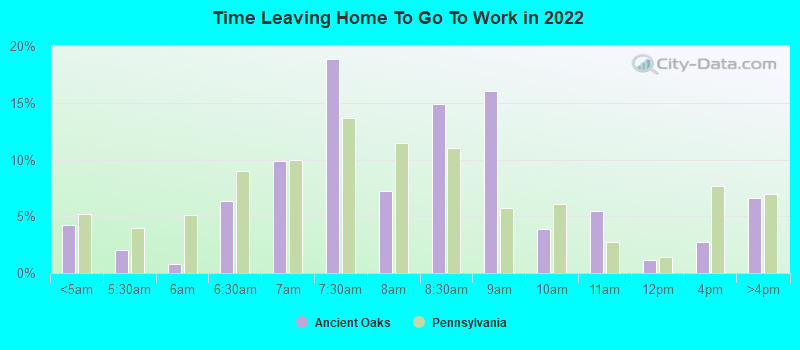
Travel time to work (commute)
Less than 5 minutes: 265 to 9 minutes: 19810 to 14 minutes: 44115 to 19 minutes: 64020 to 24 minutes: 55225 to 29 minutes: 18430 to 34 minutes: 37735 to 39 minutes: 6440 to 44 minutes: 1445 to 59 minutes: 10560 to 89 minutes: 16490 or more minutes: 151
Means of transportation to work:
Drove a car alone: 1,506 (86.6%)Carpooled: 145 (8.3%)Walked: 48 (2.8%)Other means: 6 (0.3%)Worked at home: 35 (2.0%)
Unemployment by race in 2022
Unemployment rate for White non-Hispanic residents 3.2% Females
Year of entry for the foreign-born population in Ancient Oaks, Pennsylvania
168 2010 or later 319 2000 to 2009 222 1990 to 1999 44 1980 to 1989 16 1970 to 1979 36 Before 1970
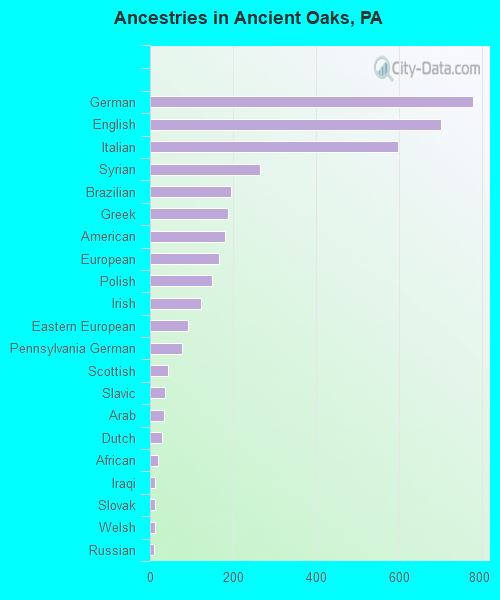
First ancestries reported:
German: 777 (16.9%)
English: 700 (15.2%)
Italian: 597 (13.0%)
Syrian: 265 (5.8%)
Brazilian: 195 (4.2%)
Greek: 187 (4.1%)
American: 180 (3.9%)
European: 166 (3.6%)
Polish: 150 (3.3%)
Irish: 122 (2.7%)
Eastern European: 92 (2.0%)
Pennsylvania German: 77 (1.7%)
Scottish: 44 (1.0%)
Slavic: 35 (0.8%)
Arab: 34 (0.7%)
Dutch: 29 (0.6%)
African: 20 (0.4%)
Iraqi: 13 (0.3%)
Slovak: 13 (0.3%)
Welsh: 13 (0.3%)
Russian: 10 (0.2%)
Swedish: 7 (0.2%) Most common places of birth for foreign-born residents (%): India Ancient Oaks:
18.3% (197)Pennsylvania:
10.7% (100,596)
Brazil Ancient Oaks:
8.9% (96)Pennsylvania:
1.4% (13,077)
Philippines Ancient Oaks:
8.8% (95)Pennsylvania:
2.2% (21,039)
China, excluding Hong Kong and Taiwan Ancient Oaks:
7.1% (76)Pennsylvania:
7.2% (67,704)
Pakistan Ancient Oaks:
6.6% (71)Pennsylvania:
1.2% (11,211)
Syria Ancient Oaks:
6.2% (67)Pennsylvania:
0.5% (5,121)
Canada Ancient Oaks:
4.6% (49)Pennsylvania:
1.8% (17,032)
Mexico Ancient Oaks:
4.3% (46)Pennsylvania:
5.8% (54,190)
Greece Ancient Oaks:
3.8% (41)Pennsylvania:
0.6% (5,438)
Iraq Ancient Oaks:
3.3% (36)Pennsylvania:
0.3% (2,395)
Argentina Ancient Oaks:
2.7% (29)Pennsylvania:
0.4% (4,113)
United Kingdom, excluding England and Scotland Ancient Oaks:
2.4% (26)Pennsylvania:
1.1% (10,331)
England Ancient Oaks:
2.3% (25)Pennsylvania:
1.0% (9,205)
Poland Ancient Oaks:
2.2% (24)Pennsylvania:
1.3% (12,172)
Colombia Ancient Oaks:
2.1% (23)Pennsylvania:
1.5% (13,823)
Italy Ancient Oaks:
2.0% (21)Pennsylvania:
1.8% (16,884)
Germany Ancient Oaks:
2.0% (21)Pennsylvania:
1.9% (18,065)
Place of birth for U.S.-born residents:
This state: 4,537Other state: 1,695Northeast: 964Midwest: 155South: 401West: 184 96.9% of Ancient Oaks residents lived in the same house 1 years ago.
Out of people who lived in different houses, 32.8% lived in this county.
Out of people who lived in different counties, 31.2% lived in Pennsylvania.
Ancient Oaks:
96.9%State average:
89.3%
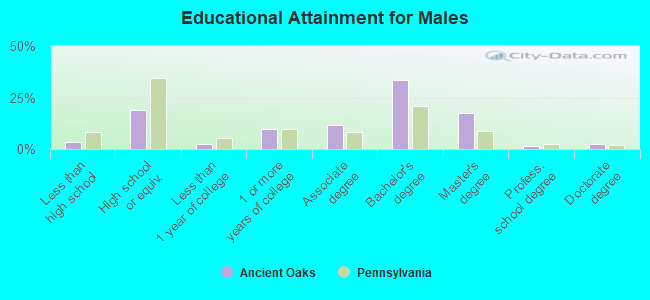
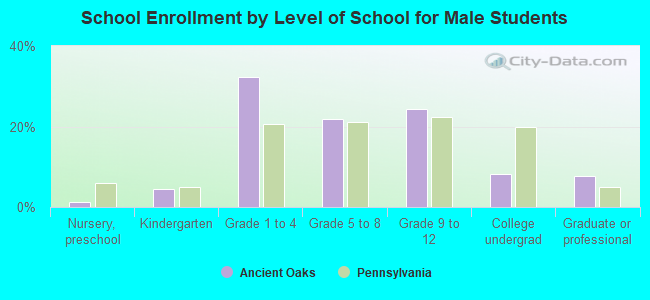
Education attainment for males 25 years and older:
No schooling: 18Nursery to 4th grade: 05th and 6th grade: 237th and 8th grade: 19th grade: 010th grade: 911th grade: 012th grade, no diploma: 22High school graduate (or equivalency): 430Less than 1 year of college: 55Some college more than 1 year, no degree: 223Associate degree: 264Bachelor's degree: 766Master's degree: 400Professional school degree: 35Doctorate degree: 52
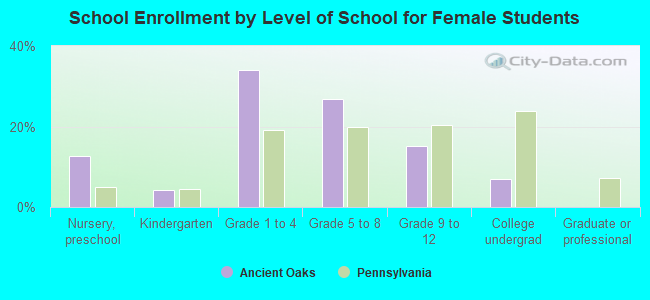
Education attainment for females 25 years and older:
No schooling: 8Nursery to 4th grade: 05th and 6th grade: 67th and 8th grade: 309th grade: 010th grade: 011th grade: 2412th grade, no diploma: 49High school graduate (or equivalency): 352Less than 1 year of college: 108Some college more than 1 year, no degree: 191Associate degree: 212Bachelor's degree: 1,002Master's degree: 356Professional school degree: 110Doctorate degree: 128
Housing units in structures:
One, detached: 1,876One, attached: 299Two: 493 or 4: 615 to 9: 17910 to 19: 12350 or more: 41House/condo owner moved in on average 12 years ago
Renter moved in on average 5 years ago
Private vs. public school enrollment:
Students in private schools in grades 1 to 8 (elementary and middle school): 132 Here:
11.4%Pennsylvania:
15.7%
Students in private schools in grades 9 to 12 (high school): 11 Here:
2.7%Pennsylvania:
13.4%
Students in private undergraduate colleges: 29 Here:
18.7%Pennsylvania:
39.8%