Alderwood Manor, WA (Washington) Houses and Residents
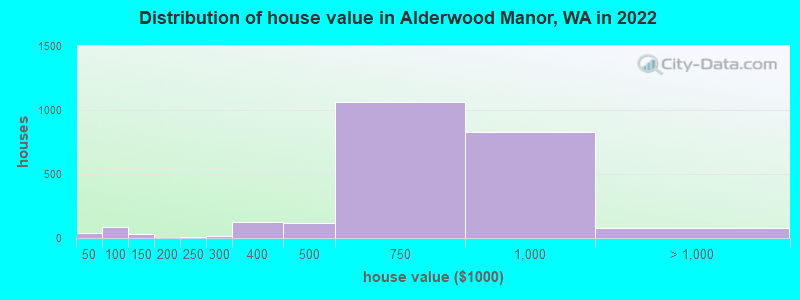
Estimated median house or condo value in 2022: $749,413 (it was $187,000 in 2000 )
Alderwood Manor:
$749,413Washington:
$569,500
Lower value quartile - upper value quartile: $578,155 - $912,761Mean price in 2022: Detached houses: $751,430 Here:
$751,430State:
$734,307
Townhouses or other attached units: $612,607 Here:
$612,607State:
$657,697
In 5-or-more-unit structures: $616,325 Here:
$616,325State:
$503,183
Mobile homes: $108,140 Here:
$108,140State:
$218,362
Total population: 8,442 (All urban)
Houses: 3,696 (3,617 occupied: 2,479 owner occupied, 1,108 renter occupied )
% of renters here:
31%State:
36%
Housing density: 770 houses/condos per square mile
Median price asked for vacant for-sale houses and condos in 2022 in this county: $628,500.
Median contract rent in 2022: $1,897 (lower quartile is $1,571, upper quartile is over $2,000)
Median rent asked for vacant for-rent units in 2022: $2,059
Median gross rent in Alderwood Manor, WA in 2022: $1,965
Housing units in Alderwood Manor with a mortgage: 1,698 (63 second mortgage, 0 home equity loan, 53 both second mortgage and home equity loan )Houses without a mortgage: 5
Median household income for houses/condos with a mortgage: $143,640
Median household income for apartments without a mortgage: $97,236
Median monthly housing costs: $1,945
Data:
Median house or condo value ($)
Median house or condo value ($ change since 2000)
Median house or condo value ($) - White
Median house or condo value ($) - Black or African American
Median house or condo value ($) - Asian
Median house or condo value ($) - Hispanic or Latino
Median house or condo value ($) - American Indian and Alaska Native
Median house or condo value ($) - Multirace
Median house or condo value ($) - Other Race
Median price asked for mobile homes ($)
Household density (households per square mile)
Mean house or condo value by units in structure - 1, detached ($)
Mean house or condo value by units in structure - 1, attached ($)
Mean house or condo value by units in structure - 2 ($)
Mean house or condo value by units in structure by units in structure - 3 or 4 ($)
Mean house or condo value by units in structure - 5 or more ($)
Mean house or condo value by units in structure - Boat, RV, van, etc. ($)
Mean house or condo value by units in structure - Mobile home ($)
Median contract rent ($)
Median contract rent - Lower quartile ($)
Median contract rent - Upper quartile ($)
Median gross rent ($)
Urban houses (%)
Rural houses (%)
Houses occupied (%)
Houses occupied (% change since 2000)
Houses owner occupied (%)
Houses owner occupied (% change since 2000)
Houses renter occupied (%)
Houses renter occupied (% change since 2000)
Vacant housing units - For rent (%)
Vacant housing units - For rent (% change since 2000)
Vacant housing units - For sale only (%)
Vacant housing units - For sale only (% change since 2000)
Vacant housing units - Rented or sold, not occupied (%)
Vacant housing units - Rented or sold, not occupied (% change since 2000)
Vacant housing units - For seasonal, recreational, or occasional use (%)
Vacant housing units - For seasonal, recreational, or occasional use (% change since 2000)
Vacant housing units - For migrant workers (%)
Vacant housing units - For migrant workers (% change since 2000)
Vacant housing units - Other vacant (%)
Vacant housing units - Other vacant (% change since 2000)
Median monthly housing costs ($)
Median household income for houses/condos with a mortgage ($)
Median household income for houses/condos without a mortgage ($)
Median household income ($)
Median household income ($) - White
Median household income ($) - Black or African American
Median household income ($) - Asian
Median household income ($) - Hispanic or Latino
Median household income ($) - American Indian and Alaska Native
Median household income ($) - Multirace
Median household income ($) - Other Race
Mortgage status - with mortgage (%)
Mortgage status - with second mortgage (%)
Mortgage status - with home equity loan (%)
Mortgage status - with both second mortgage and home equity loan (%)
Mortgage status - without a mortgage (%)
Median year house/condo built
Median year apartment built
Household type by relationship - Male householder living alone (%)
Household type by relationship - Male householder not living alone (%)
Household type by relationship - Female householder living alone (%)
Household type by relationship - Female householder not living alone (%)
Household type by relationship - Opposite-Sex spouse (%)
Household type by relationship - Same-Sex spouse (%)
Household type by relationship - Opposite-Sex unmarried partner (%)
Household type by relationship - Same-Sex unmarried partner (%)
Household type by relationship - In group quarters (%)
Size of family households - 2-person household (%)
Size of family households - 3-person household (%)
Size of family households - 4-person household (%)
Size of family households - 5-person household (%)
Size of family households - 6-person household (%)
Size of family households - 7-or-more-person household (%)
Size of nonfamily households - 1-person household (%)
Size of nonfamily households - 2-person household (%)
Size of nonfamily households - 3-person household (%)
Size of nonfamily households - 4-person household (%)
Size of nonfamily households - 5-person household (%)
Size of nonfamily households - 6-person household (%)
Size of nonfamily households - 7-or-moreperson household (%)
Year house built - Built 2010 or later (%)
Year house built - Built 2000 to 2009 (%)
Year house built - Built 1990 to 1999 (%)
Year house built - Built 1980 to 1989 (%)
Year house built - Built 1970 to 1979 (%)
Year house built - Built 1960 to 1969 (%)
Year house built - Built 1950 to 1959 (%)
Year house built - Built 1940 to 1949 (%)
Year house built - Built 1939 or earlier (%)
Median number of rooms in houses and condos
Median number of rooms in apartments
Median number of bedrooms in owner occupied houses
Mean number of bedrooms in owner occupied houses
Median number of bedrooms in renter occupied houses
Mean number of bedrooms in renter occupied houses
Median number of vehichles in owner occupied houses
Mean number of vehichles in owner occupied houses
Median number of vehichles in renter occupied houses
Mean number of vehichles in renter occupied houses
Rooms in owner-occupied houses - 1 room (%)
Rooms in owner-occupied houses - 2 rooms (%)
Rooms in owner-occupied houses - 3 rooms (%)
Rooms in owner-occupied houses - 4 rooms (%)
Rooms in owner-occupied houses - 5 rooms (%)
Rooms in owner-occupied houses - 6 rooms (%)
Rooms in owner-occupied houses - 7 rooms (%)
Rooms in owner-occupied houses - 8 rooms (%)
Rooms in owner-occupied houses - 9+ rooms (%)
Rooms in renter-occupied houses - 1 room (%)
Rooms in renter-occupied houses - 2 rooms (%)
Rooms in renter-occupied houses - 3 rooms (%)
Rooms in renter-occupied houses - 4 rooms (%)
Rooms in renter-occupied houses - 5 rooms (%)
Rooms in renter-occupied houses - 6 rooms (%)
Rooms in renter-occupied houses - 7 rooms (%)
Rooms in renter-occupied houses - 8 rooms (%)
Rooms in renter-occupied houses - 9+ rooms (%)
Bedrooms in owner-occupied houses - no bedrooms (%)
Bedrooms in owner-occupied houses - 1 bedroom (%)
Bedrooms in owner-occupied houses - 2 bedrooms (%)
Bedrooms in owner-occupied houses - 3 bedrooms (%)
Bedrooms in owner-occupied houses - 4 bedrooms (%)
Bedrooms in owner-occupied houses - 5+ bedrooms (%)
Bedrooms in renter-occupied houses - no bedrooms (%)
Bedrooms in renter-occupied houses - 1 bedroom (%)
Bedrooms in renter-occupied houses - 2 bedrooms (%)
Bedrooms in renter-occupied houses - 3 bedrooms (%)
Bedrooms in renter-occupied houses - 4 bedrooms (%)
Bedrooms in renter-occupied houses - 5+ bedrooms (%)
Vehicles available in owner-occupied houses - no vehicle available (%)
Vehicles available in owner-occupied houses - 1 vehicle available(%)
Vehicles available in owner-occupied houses - 2 Vehicles available (%)
Vehicles available in owner-occupied houses - 3 Vehicles available (%)
Vehicles available in owner-occupied houses - 4 Vehicles available (%)
Vehicles available in owner-occupied houses - 5+ Vehicles available (%)
Vehicles available in renter-occupied houses - no vehicle available (%)
Vehicles available in renter-occupied houses - 1 vehicle available (%)
Vehicles available in renter-occupied houses - 2 Vehicles available (%)
Vehicles available in renter-occupied houses - 3 Vehicles available (%)
Vehicles available in renter-occupied houses - 4 Vehicles available (%)
Vehicles available in renter-occupied houses - 5+ Vehicles available (%)
Housing units in structures - 1, detached (%)
Housing units in structures - 1, attached (%)
Housing units in structures - 2 (%)
Housing units in structures - 3 or 4 (%)
Housing units in structures - 5 to 9 (%)
Housing units in structures - 10 to 19 (%)
Housing units in structures - 20 to 49 (%)
Housing units in structures - 50 or more (%)
Housing units in structures - Mobile home (%)
Housing units in structures - Boat, RV, van, etc. (%)
Housing units in structures - Owners - 1, detached (%)
Housing units in structures - Owners - 1, attached (%)
Housing units in structures - Owners - 2 (%)
Housing units in structures - Owners - 3 or 4 (%)
Housing units in structures - Owners - 5 to 9 (%)
Housing units in structures - Owners - 10 to 19 (%)
Housing units in structures - Owners - 20 to 49 (%)
Housing units in structures - Owners - 50 or more (%)
Housing units in structures - Owners - Mobile home (%)
Housing units in structures - Owners - Boat, RV, van, etc. (%)
Housing units in structures - Renters - 1, detached (%)
Housing units in structures - Renters - 1, attached (%)
Housing units in structures - Renters - 2 (%)
Housing units in structures - Renters - 3 or 4 (%)
Housing units in structures - Renters - 5 to 9 (%)
Housing units in structures - Renters - 10 to 19 (%)
Housing units in structures - Renters - 20 to 49 (%)
Housing units in structures - Renters - 50 or more (%)
Housing units in structures - Renters - Mobile home (%)
Housing units in structures - Renters - Boat, RV, van, etc. (%)
House/condo owner moved in on average (years ago)
Renter moved in on average (years ago)
Year householder moved into unit - Moved in 1999 to March 2000 (%)
Year householder moved into unit - Moved in 1999 to March 2000 (%) - White
Year householder moved into unit - Moved in 1999 to March 2000 (%) - Black or African American
Year householder moved into unit - Moved in 1999 to March 2000 (%) - Asian
Year householder moved into unit - Moved in 1999 to March 2000 (%) - Hispanic or Latino
Year householder moved into unit - Moved in 1999 to March 2000 (%) - American Indian and Alaska Native
Year householder moved into unit - Moved in 1999 to March 2000 (%) - Multirace
Year householder moved into unit - Moved in 1999 to March 2000 (%) - Other Race
Year householder moved into unit - Moved in 1995 to 1998 (%)
Year householder moved into unit - Moved in 1995 to 1998 (%) - White
Year householder moved into unit - Moved in 1995 to 1998 (%) - Black or African American
Year householder moved into unit - Moved in 1995 to 1998 (%) - Asian
Year householder moved into unit - Moved in 1995 to 1998 (%) - Hispanic or Latino
Year householder moved into unit - Moved in 1995 to 1998 (%) - American Indian and Alaska Native
Year householder moved into unit - Moved in 1995 to 1998 (%) - Multirace
Year householder moved into unit - Moved in 1995 to 1998 (%) - Other Race
Year householder moved into unit - Moved in 1990 to 1994 (%)
Year householder moved into unit - Moved in 1990 to 1994 (%) - White
Year householder moved into unit - Moved in 1990 to 1994 (%) - Black or African American
Year householder moved into unit - Moved in 1990 to 1994 (%) - Asian
Year householder moved into unit - Moved in 1990 to 1994 (%) - Hispanic or Latino
Year householder moved into unit - Moved in 1990 to 1994 (%) - American Indian and Alaska Native
Year householder moved into unit - Moved in 1990 to 1994 (%) - Multirace
Year householder moved into unit - Moved in 1990 to 1994 (%) - Other Race
Year householder moved into unit - Moved in 1980 to 1989 (%)
Year householder moved into unit - Moved in 1980 to 1989 (%) - White
Year householder moved into unit - Moved in 1980 to 1989 (%) - Black or African American
Year householder moved into unit - Moved in 1980 to 1989 (%) - Asian
Year householder moved into unit - Moved in 1980 to 1989 (%) - Hispanic or Latino
Year householder moved into unit - Moved in 1980 to 1989 (%) - American Indian and Alaska Native
Year householder moved into unit - Moved in 1980 to 1989 (%) - Multirace
Year householder moved into unit - Moved in 1980 to 1989 (%) - Other Race
Year householder moved into unit - Moved in 1970 to 1979 (%)
Year householder moved into unit - Moved in 1970 to 1979 (%) - White
Year householder moved into unit - Moved in 1970 to 1979 (%) - Black or African American
Year householder moved into unit - Moved in 1970 to 1979 (%) - Asian
Year householder moved into unit - Moved in 1970 to 1979 (%) - Hispanic or Latino
Year householder moved into unit - Moved in 1970 to 1979 (%) - American Indian and Alaska Native
Year householder moved into unit - Moved in 1970 to 1979 (%) - Multirace
Year householder moved into unit - Moved in 1970 to 1979 (%) - Other Race
Year householder moved into unit - Moved in 1969 or earlier (%)
Year householder moved into unit - Moved in 1969 or earlier (%) - White
Year householder moved into unit - Moved in 1969 or earlier (%) - Black or African American
Year householder moved into unit - Moved in 1969 or earlier (%) - Asian
Year householder moved into unit - Moved in 1969 or earlier (%) - Hispanic or Latino
Year householder moved into unit - Moved in 1969 or earlier (%) - American Indian and Alaska Native
Year householder moved into unit - Moved in 1969 or earlier (%) - Multirace
Year householder moved into unit - Moved in 1969 or earlier (%) - Other Race
Housing units lacking complete plumbing facilities (%)
Housing units lacking complete kitchen facilities (%)
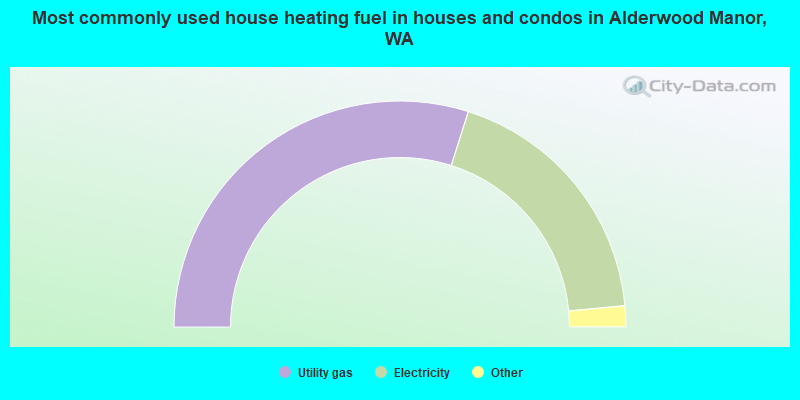
House heating fuel used in houses and condos - Utility gas (%)
House heating fuel used in houses and condos - Bottled, tank, or LP gas (%)
House heating fuel used in houses and condos - Electricity (%)
House heating fuel used in houses and condos - Fuel oil, kerosene, etc. (%)
House heating fuel used in houses and condos - Coal or coke (%)
House heating fuel used in houses and condos - Wood (%)
House heating fuel used in houses and condos - Solar energy (%)
House heating fuel used in houses and condos - Other fuel (%)
House heating fuel used in houses and condos - No fuel used (%)
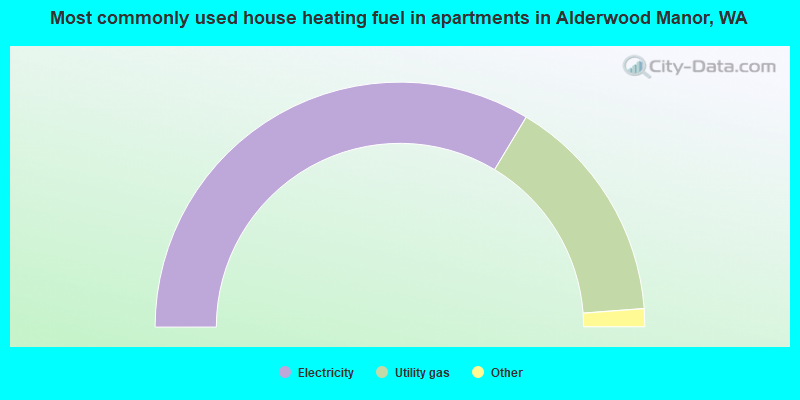
House heating fuel used in apartments - Utility gas (%)
House heating fuel used in apartments - Bottled, tank, or LP gas (%)
House heating fuel used in apartments - Electricity (%)
House heating fuel used in apartments - Fuel oil, kerosene, etc. (%)
House heating fuel used in apartments - Coal or coke (%)
House heating fuel used in apartments - Wood (%)
House heating fuel used in apartments - Solar energy (%)
House heating fuel used in apartments - Other fuel (%)
House heating fuel used in apartments - No fuel used (%)
Median year house/condo built: 1980Median year apartment built: 1995Household type by relationship:
Households: 10,674
Male householders: 1,672 (388 living alone ), Female householders: 1,882 (227 living alone )2,097 spouses (2,085 opposite-sex spouses ), 373 unmarried partners , (351 opposite-sex unmarried partners ), 3,496 children (3,408 natural , 20 adopted , 67 stepchildren ), 163 grandchildren , 247 brothers or sisters , 250 parents , 0 foster children , 56 other relatives , 368 non-relatives In group quarters: 65
Size of family households: 810 2-persons , 764 3-persons , 655 4-persons , 204 5-persons , 40 6-persons , 63 7-or-more-persons .
Size of nonfamily households: 655 1-person , 209 2-persons , 142 3-persons , 8 5-persons .
1,781 married couples with children. single-parent households (52 men , 177 women ).
57.3% of residents of Alderwood Manor speak English at home. of residents speak Spanish at home (74% speak English very well , 11% speak English well , 15% speak English not well ).of residents speak other Indo-European language at home (97% speak English very well , 3% speak English not well ).of residents speak Asian or Pacific Island language at home (62% speak English very well , 27% speak English well , 10% speak English not well , 1% don't speak English at all ).of residents speak other language at home (72% speak English very well , 18% speak English well , 9% speak English not well ).
Foreign born population: 2,860 (26.8%)of them are naturalized citizens )
Median number of rooms in houses and condos:
Median number of rooms in apartments
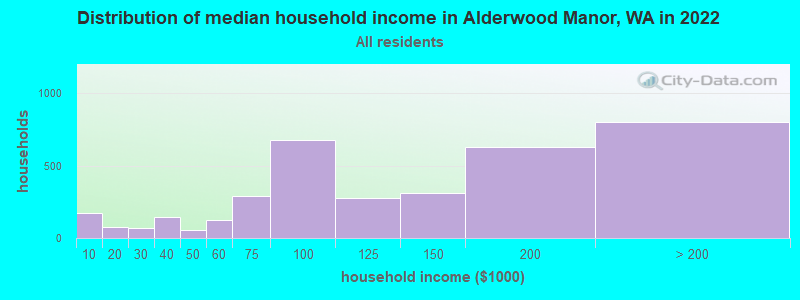
Alderwood Manor, WA household income distribution 176 Less than $10,00073 $10,000 to $19,99970 $20,000 to $29,999146 $30,000 to $39,99954 $40,000 to $49,999126 $50,000 to $59,999287 $60,000 to $74,999678 $75,000 to $99,999277 $100,000 to $124,999312 $125,000 to $149,999631 $150,000 to $199,999802 $200,000 or more
Home value of owner - occupied houses in 2022 in Alderwood Manor, WA 31 Less than $10,0005 $15,000 to $19,99950 $60,000 to $69,99922 $70,000 to $79,9999 $90,000 to $99,9998 $100,000 to $124,99926 $125,000 to $149,9997 $200,000 to $249,99915 $250,000 to $299,999125 $300,000 to $399,999118 $400,000 to $499,9991,062 $500,000 to $749,999827 $750,000 to $999,99974 $1,000,000 to $1,499,999Rent paid by renters in 2022 in Alderwood Manor, WA 25 $350 to $39913 $400 to $44941 $900 to $99919 $1,000 to $1,249139 $1,250 to $1,499439 $1,500 to $1,999158 $2,000 to $2,499196 $2,500 to $2,999121 $3,000 to $3,4996 $3,500 or more31 No cash rent
Percentage of workers working in this county: 59.9%Number of people working at home: 1,734 (31.6% of all workers )
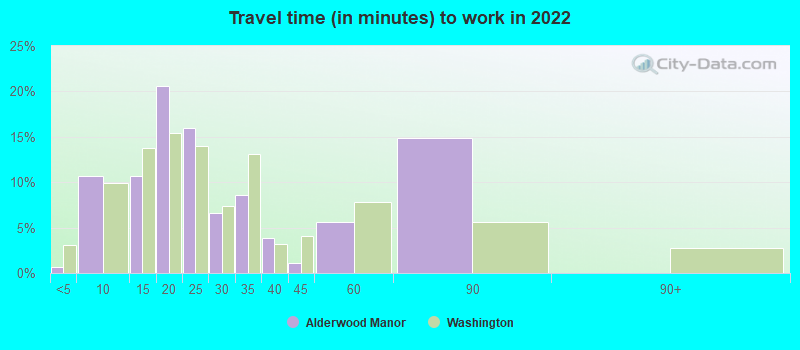
Travel time to work (commute)
Less than 5 minutes: 1465 to 9 minutes: 28010 to 14 minutes: 33515 to 19 minutes: 40820 to 24 minutes: 52625 to 29 minutes: 39630 to 34 minutes: 48635 to 39 minutes: 15040 to 44 minutes: 19445 to 59 minutes: 50260 to 89 minutes: 40790 or more minutes: 66
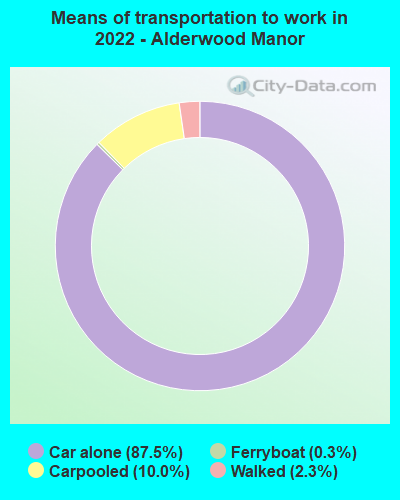
Means of transportation to work:
Drove a car alone: 888 (36.7%)Carpooled: 108 (4.5%)Ferryboat: 3 (0.1%)Walked: 27 (1.1%)Worked at home: 1,734 (71.7%)
Unemployment by race in 2022
Unemployment rate for White non-Hispanic residents 6.1% Males0.6% FemalesUnemployment rate for Black residents 6.0% MalesUnemployment rate for Asian residents 2.8% FemalesUnemployment rate for two or more race residents 24.9% FemalesUnemployment rate for Hispanic or Latino residents 20.5% Females
Year of entry for the foreign-born population in Alderwood Manor, Washington
543 2010 or later 632 2000 to 2009 738 1990 to 1999 626 1980 to 1989 237 1970 to 1979 245 Before 1970
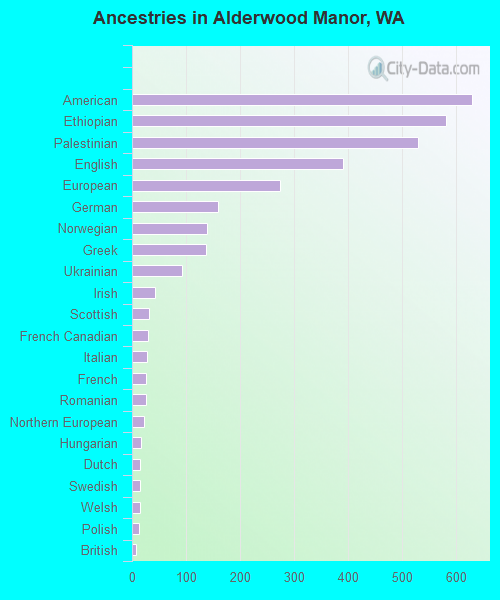
First ancestries reported:
American: 629 (10.2%)
Ethiopian: 580 (9.4%)
Palestinian: 530 (8.6%)
English: 391 (6.4%)
European: 273 (4.4%)
German: 159 (2.6%)
Norwegian: 138 (2.2%)
Greek: 136 (2.2%)
Ukrainian: 92 (1.5%)
Irish: 43 (0.7%)
Scottish: 32 (0.5%)
French Canadian: 29 (0.5%)
Italian: 27 (0.4%)
French: 26 (0.4%)
Romanian: 25 (0.4%)
Northern European: 23 (0.4%)
Hungarian: 17 (0.3%)
Dutch: 15 (0.2%)
Swedish: 15 (0.2%)
Welsh: 15 (0.2%)
Polish: 13 (0.2%)
British: 7 (0.1%)
Afghan: 5 (0.08%) Most common places of birth for foreign-born residents (%): Mexico Alderwood Manor:
19.0% (541)Washington:
21.1% (241,655)
Ethiopia Alderwood Manor:
12.8% (364)Washington:
1.6% (17,938)
Vietnam Alderwood Manor:
8.0% (227)Washington:
5.4% (62,003)
China, excluding Hong Kong and Taiwan Alderwood Manor:
6.9% (196)Washington:
7.4% (84,470)
Philippines Alderwood Manor:
5.2% (149)Washington:
6.3% (71,661)
Korea Alderwood Manor:
5.1% (145)Washington:
4.3% (48,886)
Other Western Africa Alderwood Manor:
4.8% (137)Washington:
0.3% (3,638)
Ukraine Alderwood Manor:
4.4% (126)Washington:
3.1% (35,872)
Lebanon Alderwood Manor:
4.2% (119)Washington:
0.2% (2,031)
Syria Alderwood Manor:
2.4% (67)Washington:
0.1% (1,624)
Peru Alderwood Manor:
2.3% (66)Washington:
0.4% (4,914)
Burma (Myanmar) Alderwood Manor:
1.8% (52)Washington:
0.3% (3,171)
Saudi Arabia Alderwood Manor:
1.8% (51)Washington:
0.2% (1,970)
Chile Alderwood Manor:
1.7% (47)Washington:
0.2% (2,221)
Place of birth for U.S.-born residents:
This state: 4,776Other state: 2,773Northeast: 141Midwest: 741South: 384West: 1,490 79.8% of Alderwood Manor residents lived in the same house 1 years ago.
Out of people who lived in different houses, 37.8% lived in this county.
Out of people who lived in different counties, 54.6% lived in Washington.
Alderwood Manor:
79.8%State average:
85.2%
Education attainment for males 25 years and older:
No schooling: 104Nursery to 4th grade: 585th and 6th grade: 07th and 8th grade: 09th grade: 2210th grade: 6711th grade: 4512th grade, no diploma: 57High school graduate (or equivalency): 910Less than 1 year of college: 168Some college more than 1 year, no degree: 678Associate degree: 235Bachelor's degree: 1,142Master's degree: 550Professional school degree: 15Doctorate degree: 15
Education attainment for females 25 years and older:
No schooling: 134Nursery to 4th grade: 115th and 6th grade: 707th and 8th grade: 49th grade: 010th grade: 011th grade: 4612th grade, no diploma: 23High school graduate (or equivalency): 488Less than 1 year of college: 208Some college more than 1 year, no degree: 653Associate degree: 374Bachelor's degree: 1,032Master's degree: 345Professional school degree: 75Doctorate degree: 14
Housing units in structures:
One, detached: 2,554One, attached: 209Two: 93 or 4: 1335 to 9: 16510 to 19: 15820 to 49: 18350 or more: 137Mobile homes: 145Median worth of mobile homes: $81,373
Housing units lacking complete kitchen facilities in 2022: 1.1%House/condo owner moved in on average 9 years ago
Renter moved in on average 2 years ago
Private vs. public school enrollment:
Students in private schools in grades 1 to 8 (elementary and middle school): 32 Here:
4.0%Washington:
12.4%
Students in private schools in grades 9 to 12 (high school): 59 Here:
16.5%Washington:
9.2%
Students in private undergraduate colleges: 187 Here:
22.6%Washington:
16.5%