Adelphi, MD (Maryland) Houses and Residents
| Adelphi: | $396,765 |
| Maryland: | $398,100 |
Mean price in 2022:
Detached houses: $463,896
Here: $463,896 State: $526,819 Townhouses or other attached units: $344,459
Here: $344,459 State: $328,305 In 5-or-more-unit structures: $127,822
Here: $127,822 State: $350,378
Total population: 15,086 (Urban population: 15,016, Rural population: 0)
Houses: 5,882 (5,461 occupied: 2,304 owner occupied, 3,181 renter occupied)
| % of renters here: | 58% |
| State: | 32% |
Housing density: 1,988 houses/condos per square mile
Median price asked for vacant for-sale houses and condos in 2022: $1,229,658.
Median contract rent in 2022: $1,501 (lower quartile is $1,252, upper quartile is $1,863)
Median rent asked for vacant for-rent units in 2022: $2,437
Median gross rent in Adelphi, MD in 2022: $1,611
Housing units in Adelphi with a mortgage: 1,750 (157 second mortgage, 0 home equity loan, 90 both second mortgage and home equity loan)
Houses without a mortgage: 19
Median household income for houses/condos with a mortgage: $118,459
Median household income for apartments without a mortgage: $71,271
Median monthly housing costs: $1,608
Compare current foreclosures near Adelphi, MD:
| Photo | Address | Area | Beds / Baths | Price | Details |
|---|---|---|---|---|---|

|
#1
Henson Ln
Temple Hills, MD 20748
|
1,566 sq. feet
|
2 baths 3 beds |
$300,000
|
show details |

|
#2
Applegarth Pl
Capitol Heights, MD 20743
|
1,200 sq. feet
|
1 baths 3 beds |
$314,900
|
show details |

|
#3
Elkhorn Ln
Bowie, MD 20716
|
1,514 sq. feet
|
2 baths 3 beds |
$415,000
|
show details |

|
#4
Wilson Ln Apt 204
Mc Lean, VA 22102
|
925 sq. feet
|
1 baths 2 beds |
$359,900
|
show details |

|
#5
Fitzgibbon Ct
Bowie, MD 20721
|
1,300 sq. feet
|
2 baths 3 beds |
$369,200
|
show details |

|
#6
Gladys Retreat Cir
Bowie, MD 20720
|
2,880 sq. feet
|
3 baths 3 beds |
$409,900
|
show details |

|
#7
Eastern Ave NE
Washington, DC 20011
|
1,024 sq. feet
|
1 baths 3 beds |
$395,000
|
show details |

|
#8
Brooke Knolls Rd
Gaithersburg, MD 20882
|
1,704 sq. feet
|
3 baths 4 beds |
$681,500
|
show details |

|
#9
Interlachen Dr Apt 111
Silver Spring, MD 20906
|
965 sq. feet
|
1 baths 2 beds |
$148,000
|
show details |

|
#10
Hammersmith Cir
Silver Spring, MD 20906
|
1,152 sq. feet
|
1 baths 3 beds |
$353,600
|
show details |
| Photo | Address | Area | Beds / Baths | Price | Details |
|---|---|---|---|---|---|

|
#11
Heming Ln
Bowie, MD 20716
|
1,800 sq. feet
|
2 baths 3 beds |
$400,000
|
show details |

|
#12
Cathedral Ave NW Apt 108
Washington, DC 20016
|
765 sq. feet
|
1 baths 1 beds |
$269,900
|
show details |

|
#13
Pooks Hill Rd Apt 1612s
Bethesda, MD 20814
|
1,250 sq. feet
|
1 baths 2 beds |
$289,000
|
show details |

|
#14
19th St NW
Washington, DC 20036
|
2,515 sq. feet
|
6 baths 8 beds |
$1,684,800
|
show details |

|
#15
17th St NW Apt 504
Washington, DC 20009
|
800 sq. feet
|
1 baths 1 beds |
$405,000
|
show details |

|
#16
Addison Rd
Capitol Heights, MD 20743
|
1,400 sq. feet
|
1 baths 3 beds |
$260,000
|
show details |

|
#17
Monroe St NW
Washington, DC 20010
|
- sq. feet
|
2 baths 2 beds |
$665,000
|
show details |

|
#18
Mandan Rd Apt 103 Unit 621
Greenbelt, MD 20770
|
1,420 sq. feet
|
2 baths 3 beds |
$179,900
|
show details |

|
#19
Pickett Dr
Suitland, MD 20746
|
1,296 sq. feet
|
1 baths 2 beds |
$335,000
|
show details |

|
#20
9th St NW
Washington, DC 20011
|
1,604 sq. feet
|
2 baths 3 beds |
$598,000
|
show details |
| Photo | Address | Area | Beds / Baths | Price | Details |
|---|---|---|---|---|---|

|
#21
Ensleigh Ln
Bowie, MD 20716
|
1,656 sq. feet
|
2 baths 3 beds |
$374,900
|
show details |

|
#22
T St SE Apt 3
Washington, DC 20020
|
- sq. feet
|
2 baths 4 beds |
$307,500
|
show details |

|
#23
Delaware Ave SW Apt N720
Washington, DC 20024
|
- sq. feet
|
1 baths 1 beds |
$149,900
|
show details |

|
#24
Brooke Ln
Upper Marlboro, MD 20772
|
- sq. feet
|
5 baths 6 beds |
$949,000
|
show details |

|
#25
Wilson Bridge Dr Unit #6770 A-2
Oxon Hill, MD 20745
|
- sq. feet
|
1 baths 1 beds |
$99,750
|
show details |

|
#26
Oakwood St SE Apt B5
Washington, DC 20032
|
628 sq. feet
|
1 baths 1 beds |
show details | |

|
#27
Holbrook Ter NE
Washington, DC 20002
|
3,164 sq. feet
|
4 baths 8 beds |
show details | |

|
#28
T Pl SE
Washington, DC 20020
|
900 sq. feet
|
2 baths 2 beds |
show details | |

|
#29
Lee Landing Dr
Falls Church, VA 22043
|
900 sq. feet
|
1 baths 2 beds |
show details | |

|
#30
Antiopi St
Annandale, VA 22003
|
2,505 sq. feet
|
2 baths 4 beds |
show details |
| Photo | Address | Area | Beds / Baths | Price | Details |
|---|---|---|---|---|---|

|
#31
Pine Ln
Alexandria, VA 22312
|
2,356 sq. feet
|
3 baths 3 beds |
show details | |

|
#32
Myrtle Ave
Bowie, MD 20720
|
3,436 sq. feet
|
2 baths 4 beds |
show details | |

|
#33
Auth Rd
Suitland, MD 20746
|
1,367 sq. feet
|
1 baths 4 beds |
show details | |

|
#34
Southern Ave SE
Washington, DC 20019
|
1,024 sq. feet
|
1 baths 3 beds |
show details | |

|
#35
Byers St
Capitol Heights, MD 20743
|
2,238 sq. feet
|
2 baths 2 beds |
show details | |

|
#36
Lumar Dr
Fort Washington, MD 20744
|
1,920 sq. feet
|
5 baths 5 beds |
show details | |

|
#37
28th St SE
Washington, DC 20020
|
1,200 sq. feet
|
3 baths 3 beds |
show details | |

|
#38
N Royal St
Alexandria, VA 22314
|
- sq. feet
|
1 baths 1 beds |
show details | |

|
#39
55th Ave
Bladensburg, MD 20710
|
1,023 sq. feet
|
3 baths 5 beds |
show details | |

|
#40
Pearl Fog Way
Dunn Loring, VA 22027
|
3,497 sq. feet
|
4 baths 4 beds |
show details |
| Photo | Address | Area | Beds / Baths | Price | Details |
|---|---|---|---|---|---|

|
#41
13th Ave
Hyattsville, MD 20782
|
1,598 sq. feet
|
1 baths 4 beds |
show details | |

|
#42
Sutton Ln
Bowie, MD 20720
|
2,132 sq. feet
|
3 baths 3 beds |
show details | |

|
#43
Henderson Chapel Ln
Bowie, MD 20720
|
4,002 sq. feet
|
3 baths 4 beds |
show details | |

|
#44
S George Mason Dr Unit 918n
Falls Church, VA 22041
|
752 sq. feet
|
1 baths 1 beds |
show details | |

|
#45
Buckland Ct
Fort Washington, MD 20744
|
1,496 sq. feet
|
2 baths 3 beds |
show details | |

|
#46
Carrollsburg Pl SW
Washington, DC 20024
|
1,720 sq. feet
|
2 baths 3 beds |
show details | |

|
#47
Deanwood Dr
Capitol Heights, MD 20743
|
640 sq. feet
|
1 baths 1 beds |
show details | |

|
#48
Plainfield St
Falls Church, VA 22043
|
1,102 sq. feet
|
3 baths 4 beds |
show details | |

|
#49
Jefferson St NW
Washington, DC 20011
|
1,280 sq. feet
|
5 baths 6 beds |
show details | |

|
Check over 1 million property listings on Foreclosure.com!
|
browse all offers | |||

Latest news about housing in Adelphi, MD collected exclusively by city-data.com from local newspapers, TV, and radio stations

 | Hyattsville Arts District Townhomes vs. Mount Rainier Real House (25 replies) |
| Prince George's Plaza District Development (314 replies) |
| RT. 1 Between College Park and Hyattsville Set To Look Very Different in 3 years. (846 replies) |
| Mid Century Houses in PG County - Maybe??? (13 replies) |
| High HOA fees (26 replies) |
| College Park - News, Events, Updates, Questions and Developments Etc. (1557 replies) |

Median year apartment built: 1973
Household type by relationship:
Households: 16,763- Male householders: 3,190 (590 living alone), Female householders: 2,140 (578 living alone)
1,707 spouses (1,688 opposite-sex spouses), 551 unmarried partners, (494 opposite-sex unmarried partners), 4,497 children (4,220 natural, 48 adopted, 228 stepchildren), 472 grandchildren, 500 brothers or sisters, 457 parents, 0 foster children, 1,322 other relatives, 1,728 non-relatives
- In group quarters: 193
Size of family households: 1,005 2-persons, 699 3-persons, 826 4-persons, 470 5-persons, 140 6-persons, 268 7-or-more-persons.
Size of nonfamily households: 1,150 1-person, 595 2-persons, 248 3-persons, 75 4-persons, 10 5-persons, 3 6-persons, 16 7-or-more-persons.
1,648 married couples with children.
1,532 single-parent households (721 men, 811 women).
26.9% of residents of Adelphi speak English at home.
50.0% of residents speak Spanish at home (36% speak English very well, 18% speak English well, 30% speak English not well, 16% don't speak English at all).
10.6% of residents speak other Indo-European language at home (49% speak English very well, 31% speak English well, 12% speak English not well, 7% don't speak English at all).
4.1% of residents speak Asian or Pacific Island language at home (37% speak English very well, 29% speak English well, 34% speak English not well).
11.6% of residents speak other language at home (66% speak English very well, 15% speak English well, 19% speak English not well, 1% don't speak English at all).
Foreign born population: 10,277 (61.3%)
(35.7% of them are naturalized citizens)
| Here: | 6.5 |
| State: | 7.3 |
| Here: | 4.0 |
| State: | 4.2 |

- Bedrooms in owner-occupied houses and condos in Adelphi, Maryland
- 7no bedroom
- 1201 bedroom
- 4752 bedrooms
- 6833 bedrooms
- 5504 bedrooms
- 4695+ bedrooms

- Bedrooms in renter-occupied apartments in Adelphi, Maryland
- 124no bedroom
- 9741 bedroom
- 1,3522 bedrooms
- 5713 bedrooms
- 444 bedrooms
- 1165+ bedrooms

- Cars and other vehicles available in Adelphi in owner-occupied houses/condos
- 91no vehicle
- 7461 vehicle
- 8142 vehicles
- 2823 vehicles
- 2154 vehicles
- 1575+ vehicles

- Cars and other vehicles available in Adelphi in renter-occupied apartments
- 485no vehicle
- 1,5801 vehicle
- 8442 vehicles
- 1853 vehicles
- 754 vehicles
- 125+ vehicles

- Rooms in owner-occupied houses in Adelphi, Maryland
- 71 room
- 02 rooms
- 1143 rooms
- 2884 rooms
- 3415 rooms
- 3556 rooms
- 2637 rooms
- 3098 rooms
- 6279+ rooms

- Rooms in renter-occupied apartments in Adelphi, Maryland
- 1241 room
- 582 rooms
- 8583 rooms
- 1,1834 rooms
- 5965 rooms
- 2206 rooms
- 607 rooms
- 448 rooms
- 399+ rooms


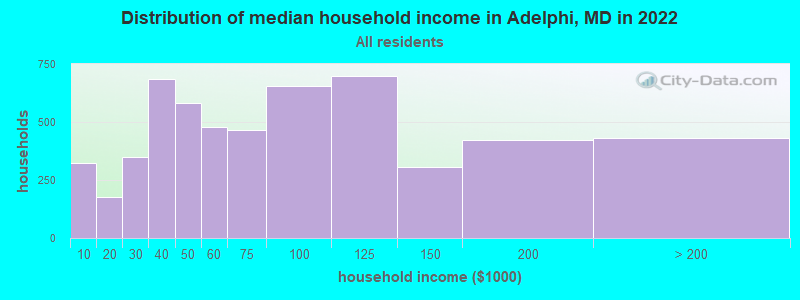
Adelphi, MD household income distribution

- 322Less than $10,000
- 177$10,000 to $19,999
- 350$20,000 to $29,999
- 687$30,000 to $39,999
- 584$40,000 to $49,999
- 478$50,000 to $59,999
- 466$60,000 to $74,999
- 655$75,000 to $99,999
- 697$100,000 to $124,999
- 305$125,000 to $149,999
- 421$150,000 to $199,999
- 432$200,000 or more
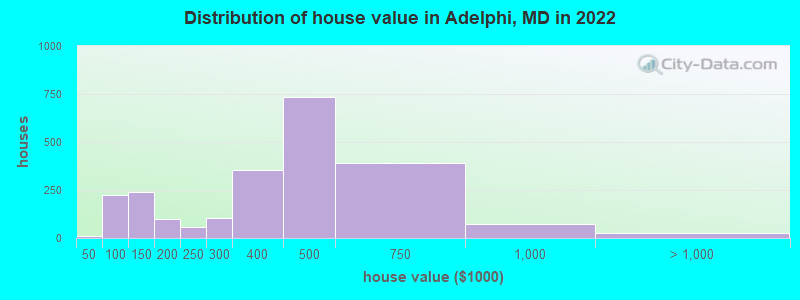
Home value of owner - occupied houses in 2022 in Adelphi, MD
-
- 10$40,000 to $49,999
- 23$50,000 to $59,999
- 4$60,000 to $69,999
- 69$70,000 to $79,999
- 30$80,000 to $89,999
- 85$90,000 to $99,999
- 127$100,000 to $124,999
- 114$125,000 to $149,999
- 64$150,000 to $174,999
- 35$175,000 to $199,999
- 56$200,000 to $249,999
- 102$250,000 to $299,999
- 355$300,000 to $399,999
- 732$400,000 to $499,999
- 389$500,000 to $749,999
- 72$750,000 to $999,999
- 27$1,000,000 to $1,499,999
Rent paid by renters in 2022 in Adelphi, MD
-
- 24$800 to $899
- 66$900 to $999
- 693$1,000 to $1,249
- 812$1,250 to $1,499
- 1,096$1,500 to $1,999
- 415$2,000 to $2,499
- 46$2,500 to $2,999
- 25$3,000 to $3,499
- 3$3,500 or more
- 20No cash rent


Percentage of workers working in this county: 46.8%
Number of people working at home: 1,004 (11.4% of all workers)
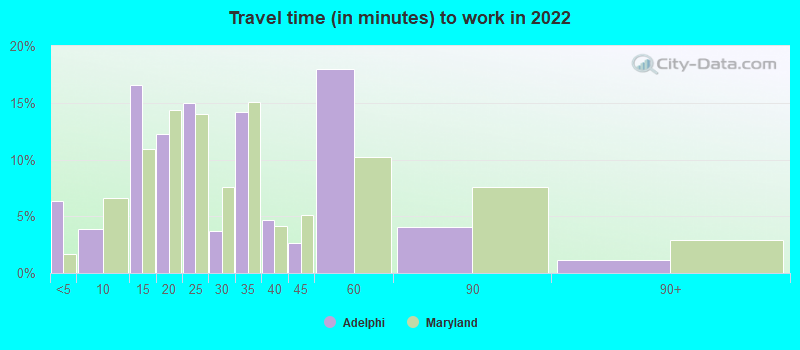
Travel time to work (commute)
- Less than 5 minutes: 18
- 5 to 9 minutes: 202
- 10 to 14 minutes: 702
- 15 to 19 minutes: 662
- 20 to 24 minutes: 1,137
- 25 to 29 minutes: 196
- 30 to 34 minutes: 1,611
- 35 to 39 minutes: 598
- 40 to 44 minutes: 554
- 45 to 59 minutes: 710
- 60 to 89 minutes: 957
- 90 or more minutes: 230
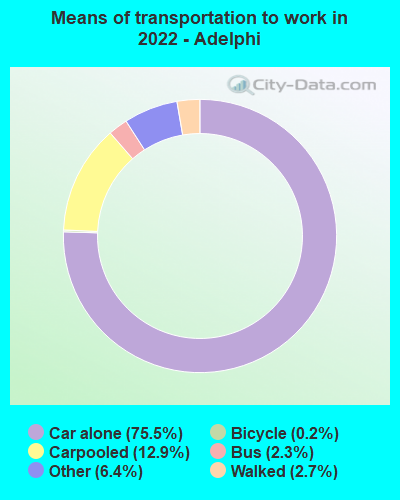
Means of transportation to work:
- Drove a car alone: 1,622 (53.6%)
- Carpooled: 251 (8.3%)
- Bus: 34 (1.1%)
- Taxi: 177 (5.8%)
- Bicycle: 4 (0.1%)
- Walked: 57 (1.9%)
- Worked at home: 1,004 (33.2%)

- Unemployment by race in 2022
- Unemployment rate for White non-Hispanic residents
- 1.1%Males
- Unemployment rate for Black residents
- 6.1%Males
- 4.7%Females
- Unemployment rate for Asian residents
- 3.6%Males
- 48.5%Females
- Unemployment rate for other race residents
- 2.4%Males
- 2.2%Females
- Unemployment rate for two or more race residents
- 14.8%Males
- 11.3%Females
- Unemployment rate for Hispanic or Latino residents
- 5.0%Males
- 4.8%Females

- Year of entry for the foreign-born population in Adelphi, Maryland
- 4,9882010 or later
- 2,5902000 to 2009
- 1,3311990 to 1999
- 2,1181980 to 1989
- 6531970 to 1979
- 323Before 1970

First ancestries reported:
- Ethiopian: 817 (6.5%)
- African: 681 (5.4%)
- Egyptian: 337 (2.7%)
- Nigerian: 266 (2.1%)
- Haitian: 225 (1.8%)
- Jamaican: 160 (1.3%)
- Irish: 117 (0.9%)
- American: 96 (0.8%)
- German: 93 (0.7%)
- Italian: 61 (0.5%)
- Moroccan: 46 (0.4%)
- Guyanese: 46 (0.4%)
- Senegalese: 37 (0.3%)
- English: 37 (0.3%)
- French: 32 (0.3%)
- Russian: 31 (0.2%)
- Kenyan: 30 (0.2%)
- Trinidadian and Tobagonian: 30 (0.2%)
- Scottish: 28 (0.2%)
- Iranian: 28 (0.2%)
- Barbadian: 18 (0.1%)
- Romanian: 18 (0.1%)
- West Indian: 15 (0.1%)
- Turkish: 14 (0.1%)
- Slavic: 14 (0.1%)
- European: 12 (0.10%)
- Scotch-Irish: 11 (0.09%)
- Dutch: 10 (0.08%)
- Ghanaian: 8 (0.06%)
- Norwegian: 8 (0.06%)
- Sierra Leonean: 5 (0.04%)
- Greek: 5 (0.04%)
- Canadian: 4 (0.03%)
- Austrian: 4 (0.03%)
- Czech: 3 (0.02%)
Most common places of birth for foreign-born residents (%):
| Adelphi: | 28.9% (2,925) |
| Maryland: | 12.0% (115,412) |
| Adelphi: | 12.1% (1,225) |
| Maryland: | 4.4% (42,350) |
| Adelphi: | 7.9% (797) |
| Maryland: | 2.5% (23,969) |
| Adelphi: | 6.1% (623) |
| Maryland: | 3.2% (30,870) |
| Adelphi: | 4.6% (467) |
| Maryland: | 2.5% (24,026) |
| Adelphi: | 3.9% (392) |
| Maryland: | 6.4% (61,725) |
| Adelphi: | 2.8% (285) |
| Maryland: | 0.1% (1,211) |
| Adelphi: | 2.5% (252) |
| Maryland: | 1.3% (12,898) |
| Adelphi: | 2.5% (250) |
| Maryland: | 1.4% (13,947) |
| Adelphi: | 2.1% (216) |
| Maryland: | 3.5% (34,065) |
| Adelphi: | 2.1% (211) |
| Maryland: | 0.9% (9,100) |
| Adelphi: | 2.0% (202) |
| Maryland: | 0.7% (7,000) |
Place of birth for U.S.-born residents:
- This state: 3,504
- Other state: 3,554
- Northeast: 738
- Midwest: 248
- South: 2,242
- West: 401
88.6% of Adelphi residents lived in the same house 1 years ago.
Out of people who lived in different houses, 37.1% lived in this county.
Out of people who lived in different counties, 64.6% lived in Maryland.
| Adelphi: | 88.6% |
| State average: | 88.5% |
Education attainment for males 25 years and older:
- No schooling: 503
- Nursery to 4th grade: 242
- 5th and 6th grade: 667
- 7th and 8th grade: 149
- 9th grade: 76
- 10th grade: 42
- 11th grade: 106
- 12th grade, no diploma: 143
- High school graduate (or equivalency): 1,179
- Less than 1 year of college: 169
- Some college more than 1 year, no degree: 545
- Associate degree: 383
- Bachelor's degree: 741
- Master's degree: 421
- Professional school degree: 262
- Doctorate degree: 175

Education attainment for females 25 years and older:
- No schooling: 431
- Nursery to 4th grade: 123
- 5th and 6th grade: 97
- 7th and 8th grade: 37
- 9th grade: 279
- 10th grade: 30
- 11th grade: 83
- 12th grade, no diploma: 74
- High school graduate (or equivalency): 1,297
- Less than 1 year of college: 232
- Some college more than 1 year, no degree: 352
- Associate degree: 493
- Bachelor's degree: 942
- Master's degree: 415
- Professional school degree: 71
- Doctorate degree: 110


Housing units in structures:
- One, detached: 1,885
- One, attached: 148
- Two: 18
- 3 or 4: 31
- 5 to 9: 204
- 10 to 19: 1,623
- 20 to 49: 507
- 50 or more: 1,422
- Mobile homes: 39
House/condo owner moved in on average 16 years ago
Renter moved in on average 2 years ago

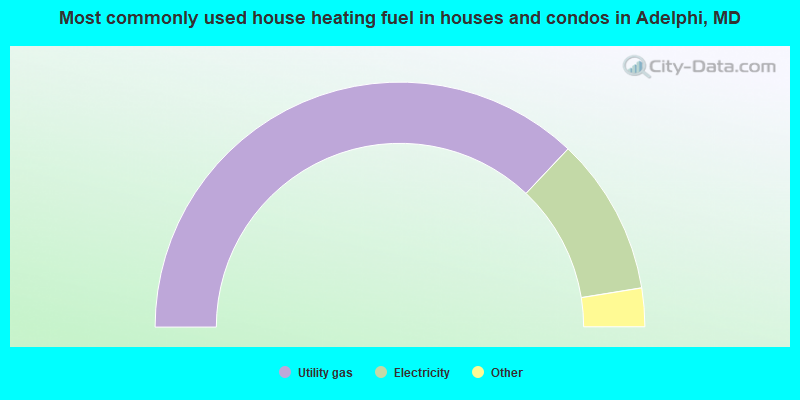
- 74.1%Utility gas
- 20.8%Electricity
- 3.3%No fuel used
- 1.1%Bottled, tank, or LP gas
- 0.8%Fuel oil, kerosene, etc.
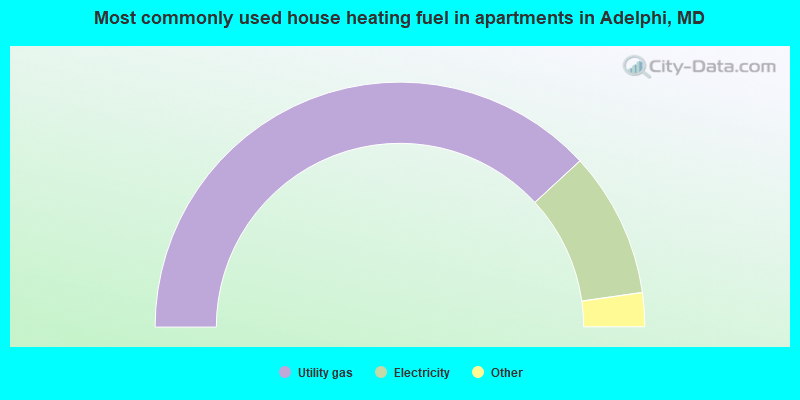
- 76.3%Utility gas
- 19.2%Electricity
- 1.5%Other fuel
- 1.2%No fuel used
- 0.6%Fuel oil, kerosene, etc.
- 0.5%Bottled, tank, or LP gas
- 0.5%Solar energy
Private vs. public school enrollment:
| Here: | 3.2% |
| Maryland: | 15.2% |
| Here: | 0.6% |
| Maryland: | 14.4% |
| Here: | 16.3% |
| Maryland: | 20.2% |


