Aberdeen, MD (Maryland) Houses and Residents
| Aberdeen: | $232,302 |
| Maryland: | $398,100 |
Total population: 15,434 (Urban population: 13,562, Rural population: 76 (all nonfarm))
Houses: 7,423 (7,022 occupied: 4,673 owner occupied, 2,421 renter occupied)
| % of renters here: | 34% |
| State: | 32% |
Housing density: 1,162 houses/condos per square mile
Median price asked for vacant for-sale houses and condos in 2022: $135,438.
Median contract rent in 2022: $1,109 (lower quartile is $823, upper quartile is $1,402)
Median rent asked for vacant for-rent units in 2022: $694
Median gross rent in Aberdeen, MD in 2022: $1,255
Housing units in Aberdeen with a mortgage: 3,227 (264 second mortgage, 63 home equity loan, 178 both second mortgage and home equity loan)
Houses without a mortgage: 78
Median household income for houses/condos with a mortgage: $100,766
Median household income for apartments without a mortgage: $65,265
Median monthly housing costs: $1,224
Compare current foreclosures in Aberdeen, MD:
| Photo | Address | Area | Beds / Baths | Price | Details |
|---|---|---|---|---|---|

|
#1
Old Stepney Rd
Aberdeen, MD 21001
|
1,656 sq. feet
|
2 baths 4 beds |
show details | |

|
#2
Mitchell Ln
Aberdeen, MD 21001
|
1,512 sq. feet
|
2 baths - beds |
show details | |

|
#3
Walker St
Aberdeen, MD 21001
|
1,326 sq. feet
|
1 baths - beds |
show details | |

|
#4
Mitchell Dr
Aberdeen, MD 21001
|
1,269 sq. feet
|
3 baths - beds |
show details | |

|
#5
Meadowcrest Ct
Aberdeen, MD 21001
|
1,466 sq. feet
|
1 baths - beds |
show details | |

|
#6
Hillman Ct
Aberdeen, MD 21001
|
1,612 sq. feet
|
2 baths - beds |
show details | |

|
#7
Nova Scotia Rd
Aberdeen, MD 21001
|
2,532 sq. feet
|
2 baths - beds |
show details | |

|
#8
Taft St
Aberdeen, MD 21001
|
1,950 sq. feet
|
2 baths - beds |
show details | |

|
#9
Wineberry Way
Aberdeen, MD 21001
|
1,560 sq. feet
|
2 baths - beds |
show details | |

|
#10
Oxford Ave
Aberdeen, MD 21001
|
1,600 sq. feet
|
1 baths - beds |
show details |
| Photo | Address | Area | Beds / Baths | Price | Details |
|---|---|---|---|---|---|

|
#11
Walker St
Aberdeen, MD 21001
|
1,309 sq. feet
|
1 baths - beds |
show details | |

|
#12
St Justin Dr
Aberdeen, MD 21001
|
2,236 sq. feet
|
2 baths - beds |
show details | |

|
#13
Chestnut St
Aberdeen, MD 21001
|
1,268 sq. feet
|
1 baths - beds |
show details | |

|
#14
Robinson Ave
Aberdeen, MD 21001
|
1,783 sq. feet
|
1 baths - beds |
show details | |

|
#15
Lark Dr
Aberdeen, MD 21001
|
2,501 sq. feet
|
1 baths - beds |
show details | |

|
#16
Farm Rd
Aberdeen, MD 21001
|
1,244 sq. feet
|
2 baths - beds |
show details | |

|
#17
Perryman Rd
Aberdeen, MD 21001
|
864 sq. feet
|
1 baths - beds |
show details | |

|
#18
Carsins Run Rd
Aberdeen, MD 21001
|
888 sq. feet
|
1 baths - beds |
show details | |

|
#19
Farm Rd
Aberdeen, MD 21001
|
1,320 sq. feet
|
1 baths - beds |
show details | |

|
#20
Hillcrest Dr
Aberdeen, MD 21001
|
2,628 sq. feet
|
3 baths - beds |
show details |
| Photo | Address | Area | Beds / Baths | Price | Details |
|---|---|---|---|---|---|

|
#21
Hays Rd
Aberdeen, MD 21001
|
1,566 sq. feet
|
2 baths - beds |
show details | |

|
#22
Rigdon Rd
Aberdeen, MD 21001
|
1,074 sq. feet
|
1 baths - beds |
show details | |

|
#23
Aberdeen Ave
Aberdeen, MD 21001
|
672 sq. feet
|
1 baths - beds |
show details | |

|
#24
Witchhazel Way
Aberdeen, MD 21001
|
2,786 sq. feet
|
2 baths - beds |
show details | |

|
#25
E Bel Air Ave
Aberdeen, MD 21001
|
1,682 sq. feet
|
1 baths - beds |
show details | |

|
#26
Windsong Dr
Aberdeen, MD 21001
|
3,996 sq. feet
|
2 baths - beds |
show details | |

|
#27
Valley Bottom Rd
Aberdeen, MD 21001
|
- sq. feet
|
- baths - beds |
show details | |

|
#28
Firefly Ct
Aberdeen, MD 21001
|
- sq. feet
|
- baths - beds |
show details | |

|
#29
Bentgrass Dr
Aberdeen, MD 21001
|
- sq. feet
|
- baths - beds |
show details | |

|
#30
Gullwing Ct
Aberdeen, MD 21001
|
- sq. feet
|
- baths - beds |
show details |
| Photo | Address | Area | Beds / Baths | Price | Details |
|---|---|---|---|---|---|

|
#31
Bisini Dr
Aberdeen, MD 21001
|
- sq. feet
|
- baths - beds |
show details | |

|
#32
Wellspring Dr
Aberdeen, MD 21001
|
- sq. feet
|
- baths - beds |
show details | |

|
#33
W Bel Air Ave # 610
Aberdeen, MD 21001
|
- sq. feet
|
- baths - beds |
show details | |

|
#34
Perception Way
Aberdeen, MD 21001
|
- sq. feet
|
- baths - beds |
show details | |

|
#35
Northeast Rd Apt 2d
Aberdeen, MD 21001
|
- sq. feet
|
- baths - beds |
show details | |

|
#36
Long Dr # 181
Aberdeen, MD 21001
|
- sq. feet
|
- baths - beds |
show details | |

|
#37
Bentgrass Dr
Aberdeen, MD 21001
|
- sq. feet
|
- baths - beds |
show details | |

|
#38
Falcon Ln
Aberdeen, MD 21001
|
- sq. feet
|
- baths - beds |
show details | |

|
#39
Poclain Rd
Aberdeen, MD 21001
|
- sq. feet
|
- baths - beds |
show details | |

|
#40
N Sewards Ct
Aberdeen, MD 21001
|
- sq. feet
|
- baths - beds |
show details |
| Photo | Address | Area | Beds / Baths | Price | Details |
|---|---|---|---|---|---|

|
#41
Wellspring Dr
Aberdeen, MD 21001
|
- sq. feet
|
- baths - beds |
show details | |

|
#42
Ordnance Cir, Apt 412
Aberdeen, MD 21001
|
- sq. feet
|
- baths - beds |
show details | |

|
#43
Custis St
Aberdeen, MD 21001
|
- sq. feet
|
- baths - beds |
show details | |

|
#44
Wineberry Way
Aberdeen, MD 21001
|
- sq. feet
|
- baths - beds |
show details | |

|
Check over 1 million property listings on Foreclosure.com!
|
browse all offers | |||

Latest news about housing in Aberdeen, MD collected exclusively by city-data.com from local newspapers, TV, and radio stations


Median year apartment built: 1973
Household type by relationship:
Households: 16,598- Male householders: 3,055 (896 living alone), Female householders: 3,930 (1,433 living alone)
2,805 spouses (2,766 opposite-sex spouses), 491 unmarried partners, (449 opposite-sex unmarried partners), 4,703 children (4,369 natural, 151 adopted, 181 stepchildren), 484 grandchildren, 119 brothers or sisters, 172 parents, 84 foster children, 335 other relatives, 374 non-relatives
- In group quarters: 40
Size of family households: 1,974 2-persons, 882 3-persons, 672 4-persons, 297 5-persons, 150 6-persons, 206 7-or-more-persons.
Size of nonfamily households: 2,572 1-person, 322 2-persons, 90 3-persons, 26 4-persons.
1,810 married couples with children.
1,340 single-parent households (456 men, 884 women).
88.7% of residents of Aberdeen speak English at home.
5.0% of residents speak Spanish at home (58% speak English very well, 15% speak English well, 22% speak English not well, 5% don't speak English at all).
1.9% of residents speak other Indo-European language at home (86% speak English very well, 10% speak English well, 4% speak English not well).
2.0% of residents speak Asian or Pacific Island language at home (56% speak English very well, 36% speak English well, 8% speak English not well).
1.8% of residents speak other language at home (66% speak English very well, 34% speak English well).
Foreign born population: 1,626 (9.8%)
(50.8% of them are naturalized citizens)
| Here: | 6.7 |
| State: | 7.3 |
| Here: | 4.5 |
| State: | 4.2 |

- Bedrooms in owner-occupied houses and condos in Aberdeen, Maryland
- 0no bedroom
- 201 bedroom
- 9552 bedrooms
- 2,3743 bedrooms
- 1,0894 bedrooms
- 2365+ bedrooms

- Bedrooms in renter-occupied apartments in Aberdeen, Maryland
- 16no bedroom
- 6981 bedroom
- 1,3012 bedrooms
- 3083 bedrooms
- 414 bedrooms
- 575+ bedrooms

- Cars and other vehicles available in Aberdeen in owner-occupied houses/condos
- 125no vehicle
- 1,3991 vehicle
- 1,8572 vehicles
- 9753 vehicles
- 1584 vehicles
- 1595+ vehicles

- Cars and other vehicles available in Aberdeen in renter-occupied apartments
- 430no vehicle
- 1,2191 vehicle
- 6192 vehicles
- 1243 vehicles
- 154 vehicles
- 135+ vehicles

- Rooms in owner-occupied houses in Aberdeen, Maryland
- 01 room
- 82 rooms
- 763 rooms
- 3414 rooms
- 7355 rooms
- 9696 rooms
- 9557 rooms
- 7278 rooms
- 8639+ rooms

- Rooms in renter-occupied apartments in Aberdeen, Maryland
- 161 room
- 1402 rooms
- 4183 rooms
- 9214 rooms
- 5035 rooms
- 2606 rooms
- 737 rooms
- 668 rooms
- 269+ rooms


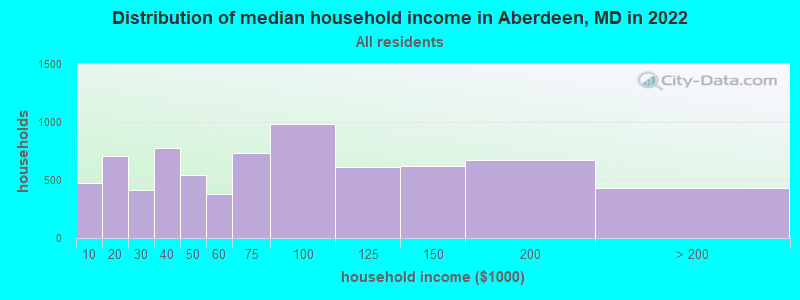
Aberdeen, MD household income distribution

- 473Less than $10,000
- 710$10,000 to $19,999
- 411$20,000 to $29,999
- 778$30,000 to $39,999
- 547$40,000 to $49,999
- 376$50,000 to $59,999
- 730$60,000 to $74,999
- 981$75,000 to $99,999
- 609$100,000 to $124,999
- 621$125,000 to $149,999
- 673$150,000 to $199,999
- 435$200,000 or more
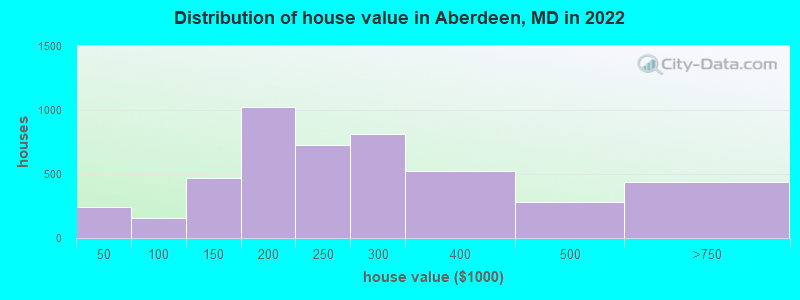
Home value of owner - occupied houses in 2022 in Aberdeen, MD
-
- 54Less than $10,000
- 31$10,000 to $14,999
- 37$15,000 to $19,999
- 63$20,000 to $24,999
- 13$25,000 to $29,999
- 29$30,000 to $34,999
- 16$40,000 to $49,999
- 6$60,000 to $69,999
- 114$80,000 to $89,999
- 20$90,000 to $99,999
- 279$100,000 to $124,999
- 186$125,000 to $149,999
- 594$150,000 to $174,999
- 432$175,000 to $199,999
- 730$200,000 to $249,999
- 813$250,000 to $299,999
- 520$300,000 to $399,999
- 282$400,000 to $499,999
- 425$500,000 to $749,999
- 9$2,000,000 or more
Rent paid by renters in 2022 in Aberdeen, MD
-
- 52Less than $100
- 20$100 to $149
- 92$150 to $199
- 18$200 to $249
- 42$250 to $299
- 13$300 to $349
- 6$450 to $499
- 8$500 to $549
- 121$600 to $649
- 41$650 to $699
- 11$750 to $799
- 287$800 to $899
- 278$900 to $999
- 535$1,000 to $1,249
- 459$1,250 to $1,499
- 217$1,500 to $1,999
- 70$2,000 to $2,499
- 45$2,500 to $2,999
- 157No cash rent


Percentage of workers working in this county: 76.5%
Number of people working at home: 798 (9.6% of all workers)
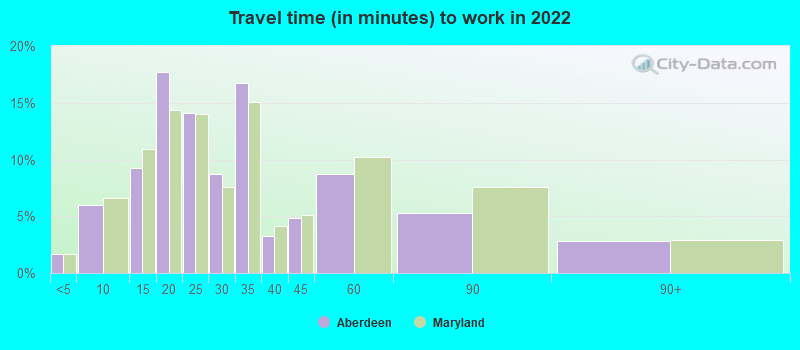
Travel time to work (commute)
- Less than 5 minutes: 119
- 5 to 9 minutes: 441
- 10 to 14 minutes: 1,102
- 15 to 19 minutes: 1,191
- 20 to 24 minutes: 1,001
- 25 to 29 minutes: 361
- 30 to 34 minutes: 1,069
- 35 to 39 minutes: 142
- 40 to 44 minutes: 332
- 45 to 59 minutes: 838
- 60 to 89 minutes: 588
- 90 or more minutes: 110
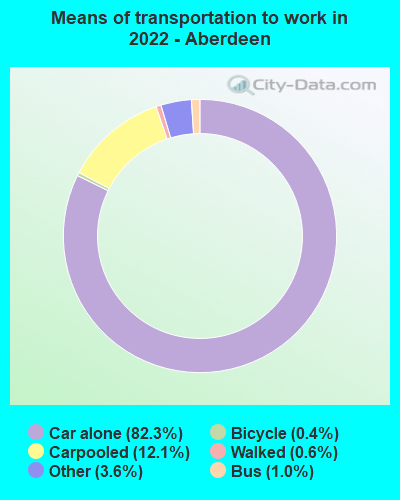
Means of transportation to work:
- Drove a car alone: 5,514 (71.7%)
- Carpooled: 863 (11.2%)
- Bus: 53 (0.7%)
- Taxi: 271 (3.5%)
- Bicycle: 29 (0.4%)
- Walked: 35 (0.5%)
- Worked at home: 793 (10.3%)

- Unemployment by race in 2022
- Unemployment rate for White non-Hispanic residents
- 2.1%Males
- 4.4%Females
- Unemployment rate for Black residents
- 1.9%Males
- 3.1%Females
- Unemployment rate for Asian residents
- 12.4%Males
- Unemployment rate for two or more race residents
- 7.0%Females

- Year of entry for the foreign-born population in Aberdeen, Maryland
- 4552010 or later
- 3982000 to 2009
- 2131990 to 1999
- 1241980 to 1989
- 811970 to 1979
- 239Before 1970

First ancestries reported:
- German: 734 (9.8%)
- American: 708 (9.5%)
- English: 425 (5.7%)
- Nigerian: 315 (4.2%)
- Irish: 297 (4.0%)
- Italian: 187 (2.5%)
- African: 144 (1.9%)
- Polish: 110 (1.5%)
- Jamaican: 56 (0.8%)
- Ghanaian: 53 (0.7%)
- European: 51 (0.7%)
- Egyptian: 40 (0.5%)
- German Russian: 39 (0.5%)
- Scottish: 33 (0.4%)
- Norwegian: 32 (0.4%)
- Russian: 16 (0.2%)
- Liberian: 16 (0.2%)
- French: 15 (0.2%)
- Welsh: 13 (0.2%)
- Greek: 11 (0.1%)
- Turkish: 10 (0.1%)
- Swiss: 9 (0.1%)
- Austrian: 6 (0.08%)
- British: 6 (0.08%)
- Guyanese: 6 (0.08%)
- Lithuanian: 5 (0.07%)
- Israeli: 4 (0.05%)
- Scotch-Irish: 1 (0.01%)
Most common places of birth for foreign-born residents (%):
| Aberdeen: | 10.6% (153) |
| Maryland: | 12.0% (115,412) |
| Aberdeen: | 10.3% (149) |
| Maryland: | 2.5% (24,026) |
| Aberdeen: | 9.8% (141) |
| Maryland: | 3.2% (30,870) |
| Aberdeen: | 8.1% (117) |
| Maryland: | 4.6% (44,825) |
| Aberdeen: | 7.2% (104) |
| Maryland: | 1.4% (13,947) |
| Aberdeen: | 7.0% (101) |
| Maryland: | 6.4% (61,725) |
| Aberdeen: | 6.2% (89) |
| Maryland: | 3.8% (36,698) |
| Aberdeen: | 5.3% (77) |
| Maryland: | 1.3% (12,898) |
| Aberdeen: | 4.0% (58) |
| Maryland: | 1.2% (11,265) |
| Aberdeen: | 3.7% (53) |
| Maryland: | 3.5% (34,065) |
| Aberdeen: | 3.1% (45) |
| Maryland: | 4.6% (44,742) |
| Aberdeen: | 3.0% (44) |
| Maryland: | 4.4% (42,350) |
| Aberdeen: | 2.8% (41) |
| Maryland: | 2.8% (27,444) |
| Aberdeen: | 2.7% (39) |
| Maryland: | 1.8% (17,774) |
| Aberdeen: | 2.5% (36) |
| Maryland: | 0.5% (4,596) |
| Aberdeen: | 2.1% (31) |
| Maryland: | 1.9% (18,716) |
| Aberdeen: | 1.9% (28) |
| Maryland: | 3.4% (32,635) |
| Aberdeen: | 1.8% (26) |
| Maryland: | 0.3% (2,475) |
Place of birth for U.S.-born residents:
- This state: 9,615
- Other state: 5,038
- Northeast: 1,868
- Midwest: 473
- South: 2,141
- West: 420
85.8% of Aberdeen residents lived in the same house 1 years ago.
Out of people who lived in different houses, 35.5% lived in this county.
Out of people who lived in different counties, 65.5% lived in Maryland.
| Aberdeen: | 85.8% |
| State average: | 88.5% |
Education attainment for males 25 years and older:
- No schooling: 41
- Nursery to 4th grade: 0
- 5th and 6th grade: 16
- 7th and 8th grade: 61
- 9th grade: 101
- 10th grade: 229
- 11th grade: 39
- 12th grade, no diploma: 130
- High school graduate (or equivalency): 1,506
- Less than 1 year of college: 427
- Some college more than 1 year, no degree: 484
- Associate degree: 726
- Bachelor's degree: 898
- Master's degree: 563
- Professional school degree: 17
- Doctorate degree: 70

Education attainment for females 25 years and older:
- No schooling: 53
- Nursery to 4th grade: 0
- 5th and 6th grade: 80
- 7th and 8th grade: 9
- 9th grade: 158
- 10th grade: 148
- 11th grade: 68
- 12th grade, no diploma: 75
- High school graduate (or equivalency): 1,659
- Less than 1 year of college: 404
- Some college more than 1 year, no degree: 863
- Associate degree: 835
- Bachelor's degree: 910
- Master's degree: 714
- Professional school degree: 63
- Doctorate degree: 43


Housing units in structures:
- One, detached: 4,482
- One, attached: 834
- 3 or 4: 145
- 5 to 9: 590
- 10 to 19: 513
- 20 to 49: 272
- 50 or more: 268
- Mobile homes: 317
Median worth of mobile homes: $28,250
Housing units lacking complete kitchen facilities in 2022: 1.2%
House/condo owner moved in on average 13 years ago
Renter moved in on average 0 years ago

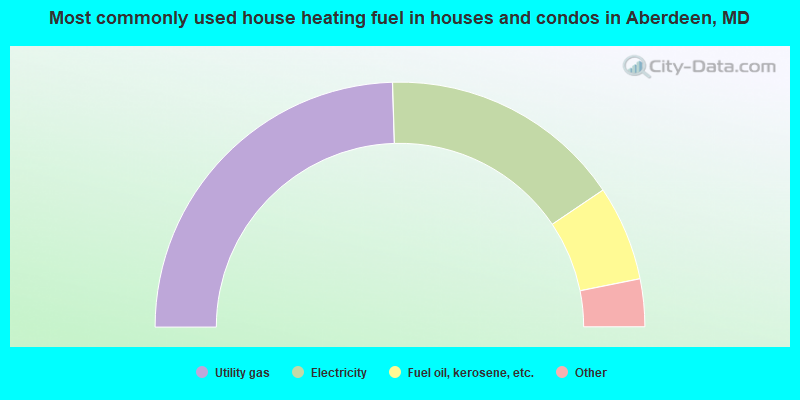
- 49.1%Utility gas
- 32.1%Electricity
- 12.6%Fuel oil, kerosene, etc.
- 3.0%Bottled, tank, or LP gas
- 1.3%Solar energy
- 0.9%Other fuel
- 0.8%No fuel used
- 0.2%Wood
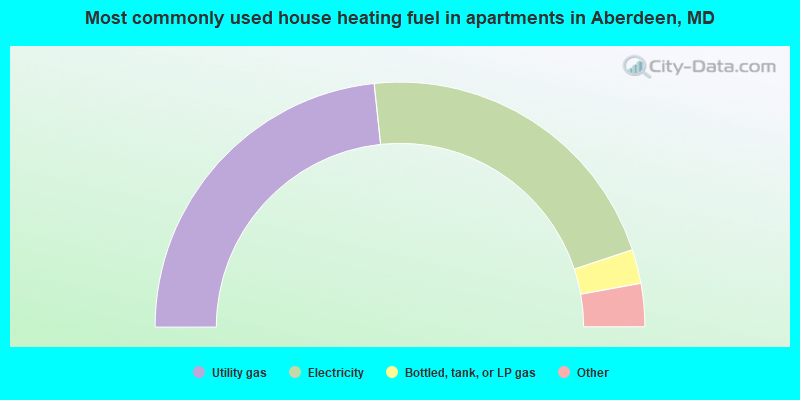
- 46.7%Utility gas
- 43.2%Electricity
- 4.5%Bottled, tank, or LP gas
- 2.8%Other fuel
- 1.7%No fuel used
- 1.1%Fuel oil, kerosene, etc.
Private vs. public school enrollment:
| Here: | 9.2% |
| Maryland: | 15.2% |
| Here: | 10.9% |
| Maryland: | 14.4% |
| Here: | 3.5% |
| Maryland: | 20.2% |


