Yakima: Fire Incidents, Washington (WA)
Where are fire incidents reported in Yakima, WA
Something went wrong! Please refresh the page.
| Fire incidents reported | |
|---|---|
| Sreet name | Count |
| 1ST ST | 542 |
| 6TH AVE | 384 |
| 16TH AVE | 370 |
| NOB HILL BLVD | 354 |
| NACHES AVE | 338 |
| 6TH ST | 334 |
| YAKIMA AVE | 326 |
| 8TH ST | 318 |
| 7TH ST | 292 |
| 5TH AVE | 262 |
| TIETON DR | 262 |
| AHTANUM RD | 234 |
| WASHINGTON AVE | 226 |
| INTERSTATE 82 | 224 |
| 4TH ST | 216 |
| 2ND AVE | 206 |
| LINCOLN AVE | 202 |
| 2ND ST | 200 |
| SUMMITVIEW AVE | 182 |
| 3RD AVE | 178 |
| FRUITVALE BLVD | 178 |
| FAIR AVE | 174 |
| CHESTNUT AVE | 168 |
| 40TH AVE | 162 |
| 9TH AVE | 152 |
| GORDON RD | 150 |
| 3RD ST | 148 |
| MEAD AVE | 132 |
| 10TH AVE | 124 |
| 9TH ST | 124 |
| Other | 3,746 |
2002 - 2018 National Fire Incident Reporting System (NFIRS) incidents
- Incident types reported to NFIRS in Yakima, WA
- 37,68355.3%Rescue & EMS
- 10,90816.0%Fire
- 7,47611.0%Good Intent Call
- 4,7877.0%Service Call
- 3,7075.4%Hazardous Condition
- 3,2824.8%False Alarm
- 1550.2%Special Incident
- 930.1%Overpressure Rupture
- Fire incident types reported to NFIRS in Yakima, WA
- 4,59342.1%Structure Fires
- 3,82335.0%Outside Fires
- 1,57614.4%Mobile Property/Vehicle Fires
- 9168.4%Other
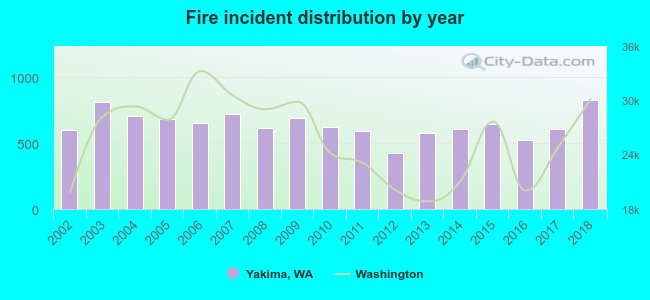 Based on the data from the years 2002 - 2018 the average number of fire incidents per year is 642. The highest number of fires - 825 took place in 2018, and the least - 428 in 2012. The data has a rising trend.
The average number of yearly fire incidents per 10k residents in Yakima, WA compared to nearest cities:
(Note: Based on data for the last 3 years, including only cities with population 5,000 and above)
| Yakima: | 69.6 |
| Union Gap: | 61.4 |
| West Valley: | 1.4 |
| Terrace Heights: | 1.4 |
| Selah: | 100.3 |
| Wapato: | 264.0 |
| Toppenish: | 151.9 |
| Ellensburg: | 81.5 |
| Sunnyside: | 59.9 |
 The median response time based on all reported fire incidents is 7 minutes. This is similar to the state median value.
The median response time in Yakima, WA compared to nearest cities:
(Note: Based on data for all years, including only cities with at least 500 fire incidents)
| Yakima: | 7 minutes |
| Union Gap: | 7 minutes |
| Selah: | 11 minutes |
| Moxee: | 10 minutes |
| Wapato: | 10 minutes |
| Naches: | 16 minutes |
| White Swan: | 14 minutes |
| Toppenish: | 8 minutes |
| Zillah: | 9 minutes |
 According to the reports from the years 2002 - 2018 the average number of fire-related yearly deaths is 1. The highest number of reported deaths - 3 took place in 2007, and the lowest - 0 in 2002. The data has a rising trend.
The average number of deaths per 1,000 fires is 1. This indicator was the highest - 4 in 2007, and the lowest 0 in 2002. The trend for fatalities per 1,000 fire incidents is increasing. Compared to the Washington value the number of deaths per 1,000 incidents is lower.
According to the reports from the years 2002 - 2018 the average number of fire-related yearly deaths is 1. The highest number of reported deaths - 3 took place in 2007, and the lowest - 0 in 2002. The data has a rising trend.
The average number of deaths per 1,000 fires is 1. This indicator was the highest - 4 in 2007, and the lowest 0 in 2002. The trend for fatalities per 1,000 fire incidents is increasing. Compared to the Washington value the number of deaths per 1,000 incidents is lower.
 Based on the reports from the years 2002 - 2018 the average number of fire-related casualties per year is 5. The highest number of casualties - 11 took place in 2005, and the lowest - 1 in 2004. The data has a growing trend.
The average number of injuries per 1,000 fires is 7. This indicator was the highest - 16 in 2005, and the lowest 1 in 2004. The trend for injuries per 1,000 fires is dropping. Compared to the Washington value the number of casualties per 1,000 fire incidents is similar.
Based on the reports from the years 2002 - 2018 the average number of fire-related casualties per year is 5. The highest number of casualties - 11 took place in 2005, and the lowest - 1 in 2004. The data has a growing trend.
The average number of injuries per 1,000 fires is 7. This indicator was the highest - 16 in 2005, and the lowest 1 in 2004. The trend for injuries per 1,000 fires is dropping. Compared to the Washington value the number of casualties per 1,000 fire incidents is similar.
 34.2% incidents where reported in the morning and 65.8% in the evening. The most fires (15.2%) took place on Saturday, and the least (13.4%) on Friday.
 According to the 10,908 fire incident reports from years 2002 - 2018 most fires (16.8%) took place during July, and the least (5.7%) in January.
 Out of all 68,131 cases reported during the years 2002 - 2018, the most belonged to the categories: Rescue & EMS (55.3%), Fire (16.0%), and Good Intent Call (11.0%).
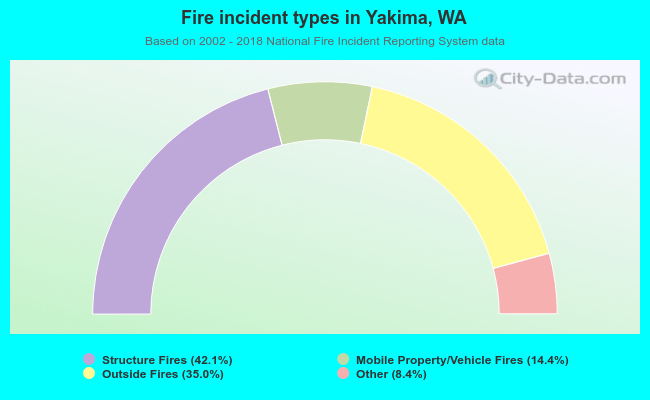 When looking into fire subcategories, the most reports belonged to: Structure Fires (42.1%), and Outside Fires (35.0%).