Winfield: Fire Incidents, Kansas (KS)
Where are fire incidents reported in Winfield, KS
Something went wrong! Please refresh the page.
| Fire incidents reported | |
|---|---|
| Sreet name | Count |
| 9TH AVE | 144 |
| US 77 HWY | 136 |
| US 160 HWY | 128 |
| 132ND RD | 116 |
| 151ST RD | 116 |
| MAIN ST | 114 |
| 91ST RD | 104 |
| 12TH AVE | 102 |
| 131ST RD | 88 |
| 19TH AVE | 84 |
| 141ST RD | 80 |
| 182ND RD | 78 |
| 101ST RD | 74 |
| 202ND RD | 74 |
| 152ND RD | 68 |
| 142ND RD | 64 |
| 172ND RD | 62 |
| 81ST RD | 60 |
| COLLEGE ST | 60 |
| 111TH RD | 58 |
| 14TH AVE | 56 |
| 192ND RD | 50 |
| 212TH RD | 50 |
| 161ST RD | 44 |
| MICHIGAN ST | 42 |
| 121ST RD | 40 |
| 5TH AVE | 38 |
| 4TH AVE | 36 |
| PIKE RD | 36 |
| COUNTRY CLUB RD | 34 |
| Other | 63 |
2002 - 2018 National Fire Incident Reporting System (NFIRS) incidents
- Incident types reported to NFIRS in Winfield, KS
- 7,40455.4%Rescue & EMS
- 2,29917.2%Fire
- 1,44010.8%Good Intent Call
- 9066.8%Hazardous Condition
- 7855.9%Service Call
- 3942.9%False Alarm
- 1190.9%Severe Weather
- 200.1%Overpressure Rupture
- Fire incident types reported to NFIRS in Winfield, KS
- 1,42962.2%Outside Fires
- 55924.3%Structure Fires
- 24410.6%Mobile Property/Vehicle Fires
- 672.9%Other
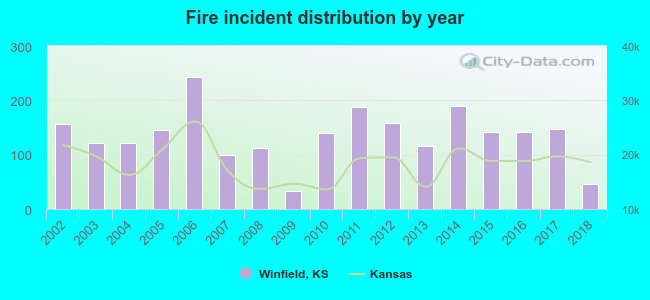 Based on the data from the years 2002 - 2018 the average number of fires per year is 135. The highest number of reported fire incidents - 243 took place in 2006, and the least - 33 in 2009. The data has a declining trend.
The average number of yearly fire incidents per 10k residents in Winfield, KS compared to nearest cities:
(Note: Based on data for the last 3 years, including only cities with population 5,000 and above)
| Winfield: | 91.1 |
| Arkansas City: | 129.5 |
| Mulvane: | 130.9 |
| Wellington: | 138.1 |
| Derby: | 66.0 |
| Haysville: | 53.7 |
| Augusta: | 154.4 |
| Andover: | 51.4 |
| Wichita: | 48.0 |
 The median response time based on all reported fire incidents is 8 minutes. This is higher compared to the Kansas median value.
The median response time in Winfield, KS compared to nearest cities:
(Note: Based on data for all years, including only cities with at least 500 fire incidents)
| Winfield: | 8 minutes |
| Udall: | 8 minutes |
| Arkansas City: | 7 minutes |
| Douglass: | 10 minutes |
| Belle Plaine: | 11 minutes |
| Mulvane: | 7 minutes |
| Wellington: | 7 minutes |
| Rose Hill: | 7 minutes |
| Derby: | 5 minutes |
 Based on the reports from the years 2002 - 2018 the average number of fire-related yearly deaths is 0. The highest number of deaths - 1 took place in 2002, and the lowest - 0 in 2003. The data has a dropping trend.
 According to the reports from the years 2002 - 2018 the average number of fire-related casualties per year is 1. The highest number of casualties - 3 took place in 2017, and the lowest - 0 in 2002. The data has a constant trend.
The average number of injuries per 1,000 fire incidents is 7. This indicator was the highest - 20 in 2017, and the lowest 0 in 2002. The trend for casualties per 1,000 fires is constant. Compared to the state value the number of casualties per 1,000 fire incidents is lower.
According to the reports from the years 2002 - 2018 the average number of fire-related casualties per year is 1. The highest number of casualties - 3 took place in 2017, and the lowest - 0 in 2002. The data has a constant trend.
The average number of injuries per 1,000 fire incidents is 7. This indicator was the highest - 20 in 2017, and the lowest 0 in 2002. The trend for casualties per 1,000 fires is constant. Compared to the state value the number of casualties per 1,000 fire incidents is lower.Casualties per 1,000 incidents in Winfield, KS compared to nearest cities:
(Note: Based on data for all years, including only cities with at least 500 fire incidents)
| Winfield: | 7.0 |
| Udall: | 0.0 |
| Arkansas City: | 7.8 |
| Douglass: | 0.0 |
| Belle Plaine: | 0.0 |
| Mulvane: | 6.8 |
| Wellington: | 4.8 |
| Rose Hill: | 10.7 |
| Derby: | 5.7 |
 24.3% incidents where reported in the morning and 75.7% in the evening. The most fires (17.9%) took place on Saturday, and the least (12.4%) on Wednesday.
 Based on the 2,299 incident reports from years 2002 - 2018 most fires (17.1%) took place during March, and the least (4.4%) in May.
 Out of all 13,373 cases reported during the years 2002 - 2018, the most belonged to the categories: Rescue & EMS (55.4%), Fire (17.2%), and Good Intent Call (10.8%).
 When looking into fire subcategories, the most incidents belonged to: Outside Fires (62.2%), and Structure Fires (24.3%).