Winfield: Fire Incidents, Illinois (IL)
Where are fire incidents reported in Winfield, IL
Something went wrong! Please refresh the page.
|
| |||||||||||||||||||||||||||||||||||||||||||||||||||||||||||||||||||||||||||||||||||||||||||||||||||||||||||||
2002 - 2018 National Fire Incident Reporting System (NFIRS) incidents
- Incident types reported to NFIRS in Winfield, IL
- 4,14155.7%Rescue & EMS
- 86211.6%Hazardous Condition
- 79410.7%False Alarm
- 6468.7%Good Intent Call
- 5948.0%Fire
- 3785.1%Service Call
- 140.2%Severe Weather
- Fire incident types reported to NFIRS in Winfield, IL
- 35259.3%Structure Fires
- 15726.4%Outside Fires
- 549.1%Mobile Property/Vehicle Fires
- 315.2%Other
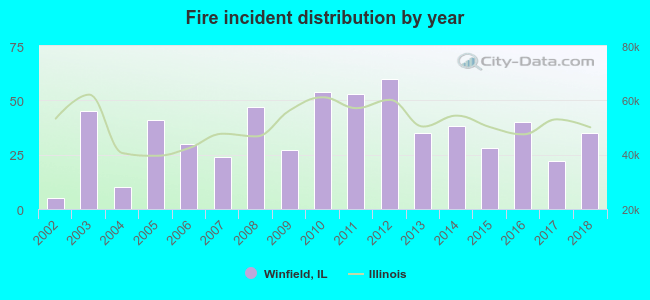 According to the data from the years 2002 - 2018 the average number of fires per year is 35. The highest number of fires - 60 took place in 2012, and the least - 5 in 2002. The data has an increasing trend.
The average number of yearly fire incidents per 10k residents in Winfield, IL compared to nearest cities:
(Note: Based on data for the last 3 years, including only cities with population 5,000 and above)
| Winfield: | 33.8 |
| Wheaton: | 18.3 |
| West Chicago: | 40.1 |
| Carol Stream: | 21.1 |
| Warrenville: | 33.7 |
| Glen Ellyn: | 26.9 |
| Glendale Heights: | 27.1 |
| Bloomingdale: | 34.5 |
| Lisle: | 29.1 |
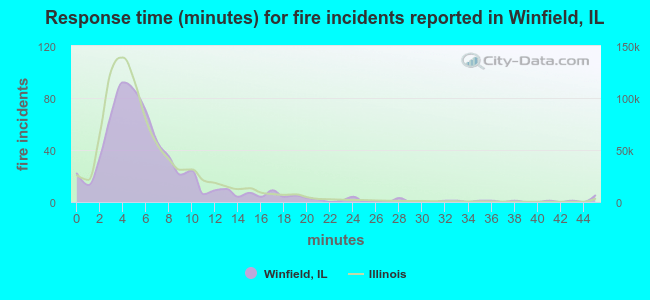 The median response time based on all reported fire incidents is 5 minutes. This is similar to the Illinois median value.
The median response time in Winfield, IL compared to nearest cities:
(Note: Based on data for all years, including only cities with at least 500 fire incidents)
| Winfield: | 5 minutes |
| Wheaton: | 5 minutes |
| West Chicago: | 6 minutes |
| Carol Stream: | 5 minutes |
| Warrenville: | 5 minutes |
| Glen Ellyn: | 6 minutes |
| Glendale Heights: | 5 minutes |
| Bloomingdale: | 5 minutes |
| Lisle: | 5 minutes |
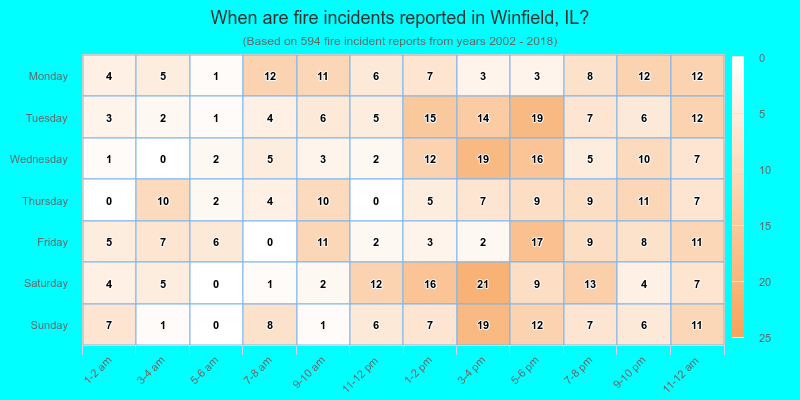
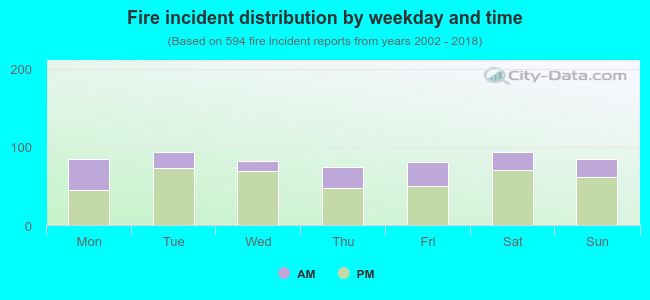 29.8% incidents where reported in the morning and 70.2% in the evening. The most fires (15.8%) took place on Tuesday, and the least (12.5%) on Thursday.
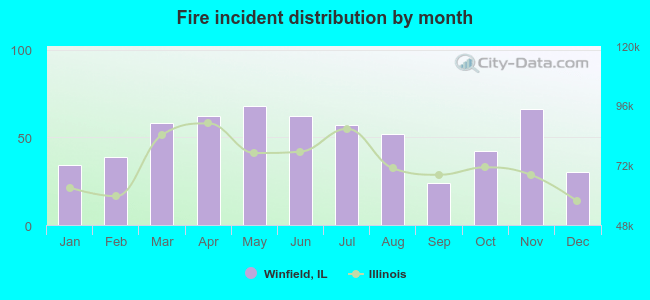 Based on the 594 fire incidents from years 2002 - 2018 most fires (11.4%) took place during May, and the least (4.0%) in September.
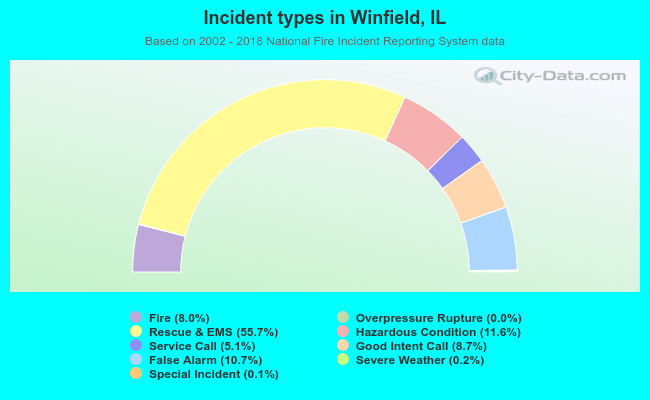 Out of all 7,439 cases reported during the years 2002 - 2018, the most belonged to the categories: Rescue & EMS (55.7%), Hazardous Condition (11.6%), and False Alarm (10.7%).
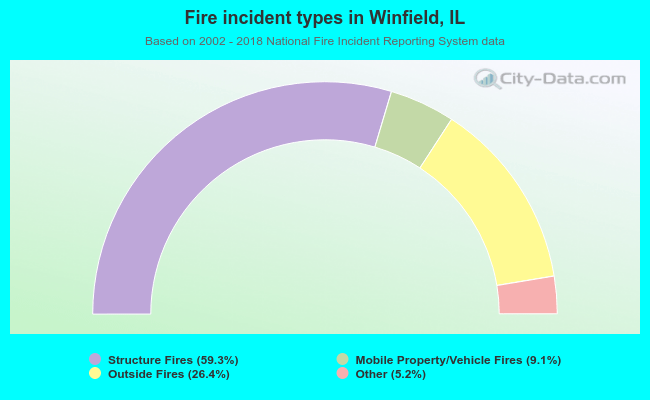 When looking into fire subcategories, the most incidents belonged to: Structure Fires (59.3%), and Outside Fires (26.4%).