Wickenburg: Fire Incidents, Arizona (AZ)
Where are fire incidents reported in Wickenburg, AZ
Something went wrong! Please refresh the page.
|
| |||||||||||||||||||||||||||||||||||||||||||||||||||||||||||||||||||||||||||||||||||||||||||||||||||||||||||||
| Other | 31 | |||||||||||||||||||||||||||||||||||||||||||||||||||||||||||||||||||||||||||||||||||||||||||||||||||||||||||||
2004 - 2018 National Fire Incident Reporting System (NFIRS) incidents
- Incident types reported to NFIRS in Wickenburg, AZ
- 2,99959.9%Rescue & EMS
- 71514.3%Service Call
- 59311.8%Good Intent Call
- 3036.1%Hazardous Condition
- 2655.3%Fire
- 1142.3%False Alarm
- 80.2%Special Incident
- 60.1%Severe Weather
- Fire incident types reported to NFIRS in Wickenburg, AZ
- 9736.6%Outside Fires
- 8030.2%Structure Fires
- 6424.2%Mobile Property/Vehicle Fires
- 249.1%Other
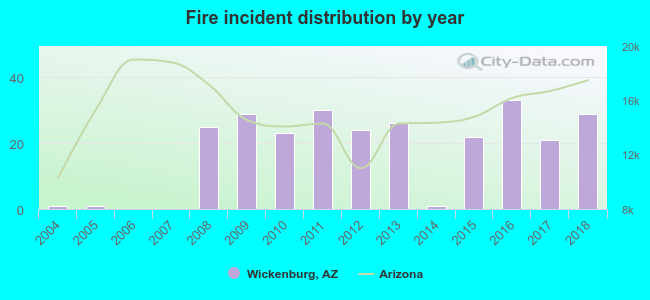 Based on the data from the years 2004 - 2018 the average number of fire incidents per year is 18. The highest number of fire incidents - 33 took place in 2016, and the least - 0 in 2006. The data has a rising trend.
The average number of yearly fire incidents per 10k residents in Wickenburg, AZ compared to nearest cities:
(Note: Based on data for the last 3 years, including only cities with population 5,000 and above)
| Wickenburg: | 41.4 |
| Surprise: | 18.8 |
| Sun City West: | 17.7 |
| El Mirage: | 32.0 |
| Anthem: | 5.5 |
| Peoria: | 6.5 |
| Sun City: | 22.6 |
| Youngtown: | 53.5 |
| Buckeye: | 28.3 |

 Based on the reports from the years 2004 - 2018 the average number of fire-related fatalities per year is 0. The highest number of deaths - 1 took place in 2010, and the lowest - 0 in 2004. The data has a constant trend.
 34.7% incidents where reported in the morning and 65.3% in the evening. The most fires (18.9%) took place on Thursday, and the least (12.1%) on Wednesday.
 Based on the 265 reports from years 2004 - 2018 most fires (12.5%) took place during May, and the least (6.0%) in January.
 Out of all 5,005 cases reported during the years 2004 - 2018, the most belonged to the categories: Rescue & EMS (59.9%), Service Call (14.3%), and Good Intent Call (11.8%).
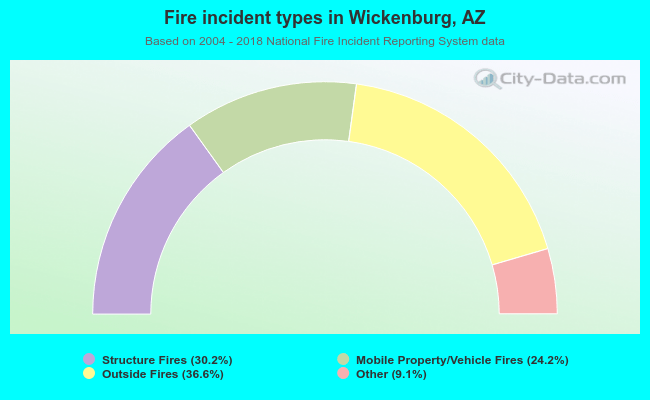 When looking into fire subcategories, the most incidents belonged to: Outside Fires (36.6%), and Structure Fires (30.2%).