Westmont: Fire Incidents, Illinois (IL)
Where are fire incidents reported in Westmont, IL
Something went wrong! Please refresh the page.
| Fire incidents reported | |
|---|---|
| Sreet name | Count |
| CASS AVE | 132 |
| OGDEN AVE | 80 |
| 63RD ST | 58 |
| WILLIAMS ST | 48 |
| 65TH ST | 46 |
| CASS AV | 44 |
| OGDEN AV | 32 |
| CASS | 30 |
| PARK ST | 30 |
| 59TH ST | 28 |
| ADAMS ST | 26 |
| PASQUINELLI DR | 26 |
| WASHINGTON ST | 26 |
| WILLIAMS | 26 |
| LINCOLN ST | 24 |
| NAPERVILLE RD | 24 |
| 60TH ST | 22 |
| 61ST ST | 22 |
| 60TH | 20 |
| BROWN DEER | 20 |
| PARK | 20 |
| PARK LN | 20 |
| 55TH ST | 18 |
| ALPINE LN | 18 |
| GRANT ST | 18 |
| QUINCY ST | 18 |
| 35TH ST | 16 |
| PIERS DR | 16 |
| FLORENCE AVE | 14 |
| OAK AVE | 14 |
2002 - 2018 National Fire Incident Reporting System (NFIRS) incidents
- Incident types reported to NFIRS in Westmont, IL
- 10,27254.6%Rescue & EMS
- 3,58719.1%False Alarm
- 1,5868.4%Service Call
- 1,4907.9%Hazardous Condition
- 9254.9%Good Intent Call
- 8984.8%Fire
- 190.1%Overpressure Rupture
- Fire incident types reported to NFIRS in Westmont, IL
- 46651.9%Structure Fires
- 30634.1%Outside Fires
- 10011.1%Mobile Property/Vehicle Fires
- 262.9%Other
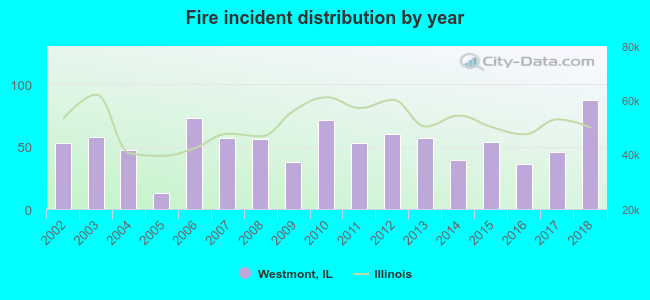 Based on the data from the years 2002 - 2018 the average number of fire incidents per year is 53. The highest number of fire incidents - 87 took place in 2018, and the least - 13 in 2005. The data has a growing trend.
The average number of yearly fire incidents per 10k residents in Westmont, IL compared to nearest cities:
(Note: Based on data for the last 3 years, including only cities with population 5,000 and above)
| Westmont: | 22.6 |
| Clarendon Hills: | 17.3 |
| Downers Grove: | 20.0 |
| Willowbrook: | 46.0 |
| Hinsdale: | 25.2 |
| Oak Brook: | 71.9 |
| Darien: | 21.1 |
| Western Springs: | 18.3 |
| Burr Ridge: | 28.8 |
 The median response time based on all reported fire incidents is 5 minutes. This is comparable to the state median value.
The median response time in Westmont, IL compared to nearest cities:
(Note: Based on data for all years, including only cities with at least 500 fire incidents)
| Westmont: | 5 minutes |
| Downers Grove: | 5 minutes |
| Willowbrook: | 5 minutes |
| Hinsdale: | 5 minutes |
| Oak Brook: | 5 minutes |
| Darien: | 5 minutes |
| Burr Ridge: | 7 minutes |
| Woodridge: | 5 minutes |
| Lisle: | 5 minutes |
 Based on the data from the years 2002 - 2018 the average number of fire-related yearly casualties is 1. The highest number of injuries - 3 took place in 2007, and the lowest - 0 in 2002. The data has a growing trend.
The average number of injuries per 1,000 fires is 20. This indicator was the highest - 56 in 2015, and the lowest 0 in 2002. The trend for casualties per 1,000 incidents is increasing. Compared to the state value the number of casualties per 1,000 incidents is higher.
Based on the data from the years 2002 - 2018 the average number of fire-related yearly casualties is 1. The highest number of injuries - 3 took place in 2007, and the lowest - 0 in 2002. The data has a growing trend.
The average number of injuries per 1,000 fires is 20. This indicator was the highest - 56 in 2015, and the lowest 0 in 2002. The trend for casualties per 1,000 incidents is increasing. Compared to the state value the number of casualties per 1,000 incidents is higher.Casualties per 1,000 incidents in Westmont, IL compared to nearest cities:
(Note: Based on data for all years, including only cities with at least 500 fire incidents)
| Westmont: | 21.2 |
| Downers Grove: | 21.9 |
| Willowbrook: | 14.9 |
| Hinsdale: | 15.1 |
| Oak Brook: | 10.9 |
| Darien: | 12.9 |
| Burr Ridge: | 14.3 |
| Woodridge: | 19.9 |
| Lisle: | 26.1 |
 39.1% incidents where reported in the morning and 60.9% in the evening. The most fires (18.4%) took place on Wednesday, and the least (9.7%) on Thursday.
 Based on the 898 fire incident reports from years 2002 - 2018 most fires (11.5%) took place during July, and the least (6.6%) in December.
 Out of all 18,802 cases reported during the years 2002 - 2018, the most belonged to the categories: Rescue & EMS (54.6%), False Alarm (19.1%), and Service Call (8.4%).
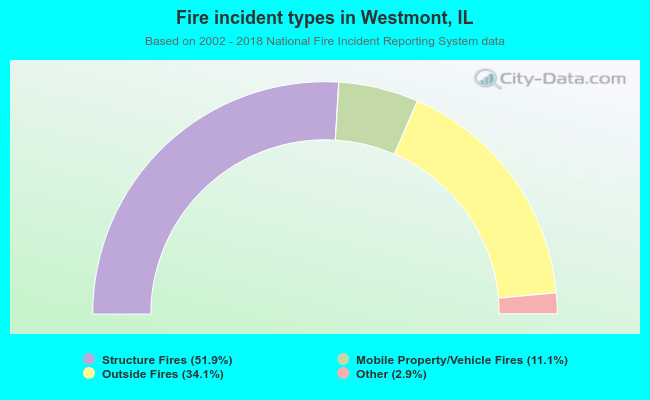 When looking into fire subcategories, the most reports belonged to: Structure Fires (51.9%), and Outside Fires (34.1%).