West Dundee: Fire Incidents, Illinois (IL)
Where are fire incidents reported in West Dundee, IL
Something went wrong! Please refresh the page.
|
| |||||||||||||||||||||||||||||||||||||||||||||||||||||||||||||||||||||||||||||||||||||||||||||||||||||||||||||
2002 - 2018 National Fire Incident Reporting System (NFIRS) incidents
- Incident types reported to NFIRS in West Dundee, IL
- 3,89250.7%Rescue & EMS
- 1,02313.3%Service Call
- 85511.1%False Alarm
- 82310.7%Hazardous Condition
- 5977.8%Good Intent Call
- 4275.6%Fire
- 260.3%Special Incident
- 210.3%Severe Weather
- Fire incident types reported to NFIRS in West Dundee, IL
- 23956.0%Structure Fires
- 11927.9%Outside Fires
- 5111.9%Mobile Property/Vehicle Fires
- 184.2%Other
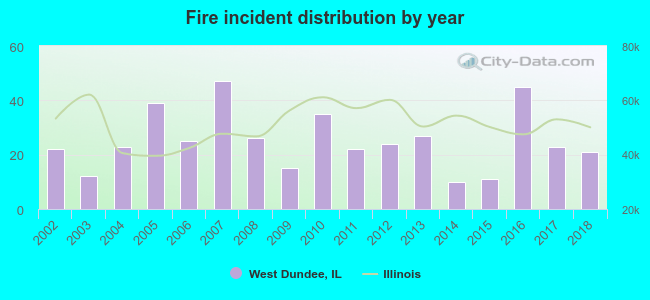 According to the data from the years 2002 - 2018 the average number of fires per year is 25. The highest number of reported fires - 47 took place in 2007, and the least - 10 in 2014. The data has a decreasing trend.
The average number of yearly fire incidents per 10k residents in West Dundee, IL compared to nearest cities:
(Note: Based on data for the last 3 years, including only cities with population 5,000 and above)
| West Dundee: | 40.1 |
| Carpentersville: | 23.7 |
| Elgin: | 28.3 |
| Gilberts: | 22.5 |
| Algonquin: | 14.0 |
| Pingree Grove: | 36.9 |
| Lake in the Hills: | 10.8 |
| South Elgin: | 28.5 |
| Streamwood: | 21.8 |

 According to the reports from the years 2002 - 2018 the average number of fire-related casualties per year is 0. The highest number of reported casualties - 2 took place in 2010, and the lowest - 0 in 2002. The data has a constant trend.
 29.7% incidents where reported in the morning and 70.3% in the evening. The most fires (16.4%) took place on Monday, and the least (11.5%) on Tuesday.
 According to the 427 fire incidents from years 2002 - 2018 most fires (11.7%) took place during April, and the least (5.2%) in March.
 Out of all 7,670 cases reported during the years 2002 - 2018, the most belonged to the categories: Rescue & EMS (50.7%), Service Call (13.3%), and False Alarm (11.1%).
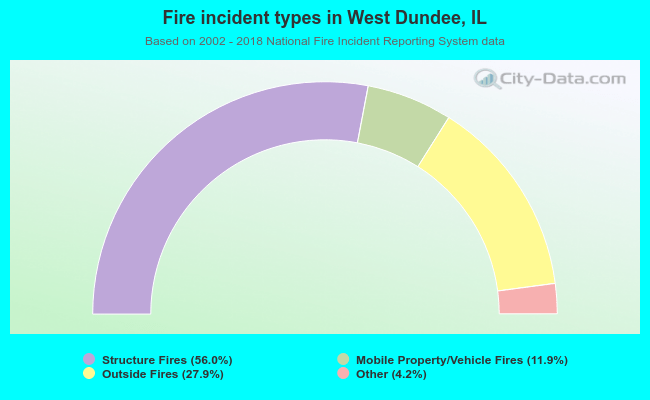 When looking into fire subcategories, the most incidents belonged to: Structure Fires (56.0%), and Outside Fires (27.9%).