| Fire incidents reported |
|---|
| Sreet name | Count |
|---|
| HWY 59 | 102 | | IH 35 HWY | 96 | | HWY 359 | 68 | | US HIGHWAY 83 | 50 | | US HIGHWAY 59 | 38 | | LAS LOMAS SUBDIVISION | 36 | | IH 35 | 32 | | PUEBLO NUEVO SUBDIVISION | 28 | | FM 1472 | 20 | | MANGANA-HEIN RD | 20 | | BOTELLO RD | 14 | | BRUNI TEXAS | 12 | | FM 2050 | 12 | | FM 2895 | 12 | | MAIN ST | 12 | | MANGANA HEIN RD | 12 | | MIRANDO CITY TEXAS | 12 | | STATE HIGHWAY 359 | 12 | | LOS ALTOS | 10 | | MINES RD | 10 | | OILTON TEXAS | 8 | | PENITAS RD | 8 | | US 83 | 8 | | WORMSER RD | 8 | | ESPEJO MOLINA RD | 6 |
| | | Fire incidents reported |
|---|
| Sreet name | Count |
|---|
| FM 3338 | 6 | | FM 649 | 6 | | IH 35 FRONTAGE RD | 6 | | PENITAS WEST DR | 6 | | SAN ENRIQUE SUBDIVISION | 6 | | SERRANO | 6 | | US 59 | 6 | | ZAPATA HWY | 6 | | EL PICO | 4 | | ENLACE RD | 4 | | FM 1472 RD | 4 | | GALVAN RANCH RD | 4 | | LAS LOMAS RD | 4 | | LAS PILAS RD | 4 | | LAS TIENDAS RD | 4 | | LOS CENTENARIOS RD | 4 | | MENDOZA ST | 4 | | OLD MILWAUKEE RD | 4 | | SERRANO RD | 4 | | SILVER MINE RD | 4 | | TANQUESITOS | 4 | | THIESEL RD | 4 | | 1 MILE WEST OF CHECKPOINT ON59 HWY | 2 | | 1472 14MILES BRISCO RANCH RNCH | 2 | | |
|
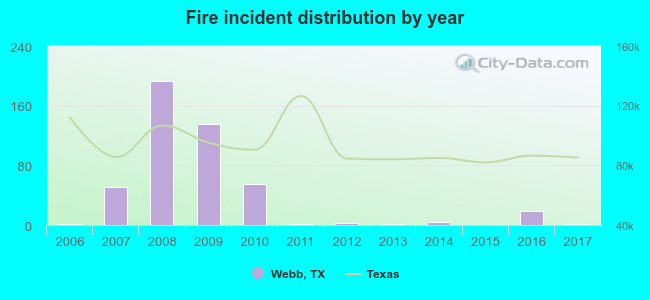 According to the data from the years 2006 - 2017 the average number of fires per year is 39. The highest number of reported fires - 193 took place in 2008, and the least - 0 in 2015. The data has a constant trend.

 23.0% incidents where reported in the morning and 77.0% in the evening. The most fires (16.8%) took place on Saturday, and the least (11.1%) on Monday.
 Based on the 470 fires from years 2006 - 2017 most fires (14.5%) took place during March, and the least (3.4%) in October.
 Out of all 653 cases reported during the years 2006 - 2017, the most belonged to the categories: Fire (72.0%), Rescue & EMS (14.1%), and Good Intent Call (6.0%).
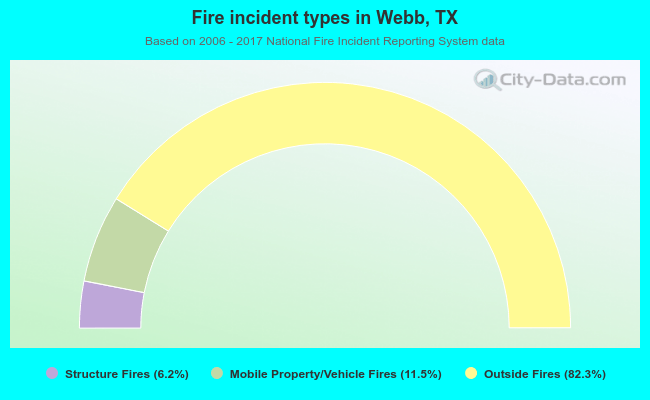 When looking into fire subcategories, the most incidents belonged to: Outside Fires (82.3%), and Mobile Property/Vehicle Fires (11.5%).