Waxhaw: Fire Incidents, North Carolina (NC)
Where are fire incidents reported in Waxhaw, NC
Something went wrong! Please refresh the page.
|
| |||||||||||||||||||||||||||||||||||||||||||||||||||||||||||||||||||||||||||||||||||||||||||||||||||||||||||||
| Other | 201 | |||||||||||||||||||||||||||||||||||||||||||||||||||||||||||||||||||||||||||||||||||||||||||||||||||||||||||||
2002 - 2018 National Fire Incident Reporting System (NFIRS) incidents
- Incident types reported to NFIRS in Waxhaw, NC
- 4,27148.9%Rescue & EMS
- 1,17913.5%Good Intent Call
- 1,08312.4%False Alarm
- 98511.3%Fire
- 6787.8%Hazardous Condition
- 5045.8%Service Call
- 250.3%Severe Weather
- Fire incident types reported to NFIRS in Waxhaw, NC
- 41642.2%Structure Fires
- 39840.4%Outside Fires
- 989.9%Other
- 737.4%Mobile Property/Vehicle Fires
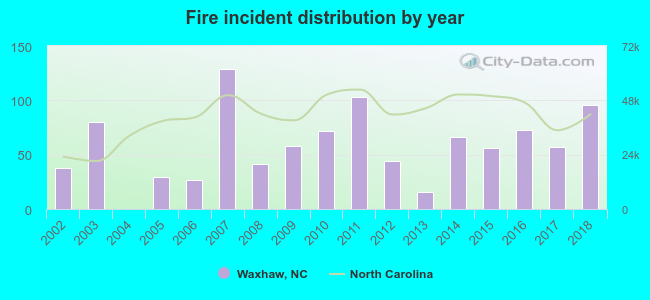 According to the data from the years 2002 - 2018 the average number of fires per year is 58. The highest number of reported fire incidents - 129 took place in 2007, and the least - 0 in 2004. The data has an increasing trend.
The average number of yearly fire incidents per 10k residents in Waxhaw, NC compared to nearest cities:
(Note: Based on data for the last 3 years, including only cities with population 5,000 and above)
| Waxhaw: | 59.1 |
| Marvin: | 8.8 |
| Weddington: | 13.6 |
| Wesley Chapel: | 13.4 |
| Indian Trail: | 24.3 |
| Stallings: | 19.4 |
| Monroe: | 70.1 |
| Matthews: | 16.6 |
| Pineville: | 44.1 |
 The median response time based on all reported fire incidents is 8 minutes. This is higher than the North Carolina median value.
The median response time in Waxhaw, NC compared to nearest cities:
(Note: Based on data for all years, including only cities with at least 500 fire incidents)
| Waxhaw: | 8 minutes |
| Indian Trail: | 7 minutes |
| Monroe: | 6 minutes |
| Matthews: | 7 minutes |
| Pineville: | 7 minutes |
| Mint Hill: | 7 minutes |
| Charlotte: | 5 minutes |
| Marshville: | 8 minutes |
| Belmont: | 7 minutes |
 25.9% incidents where reported in the morning and 74.1% in the evening. The most fires (17.1%) took place on Saturday, and the least (13.0%) on Wednesday.
 Based on the 985 reports from years 2002 - 2018 most fires (12.4%) took place during February, and the least (5.7%) in June.
 Out of all 8,737 cases reported during the years 2002 - 2018, the most belonged to the categories: Rescue & EMS (48.9%), Good Intent Call (13.5%), and False Alarm (12.4%).
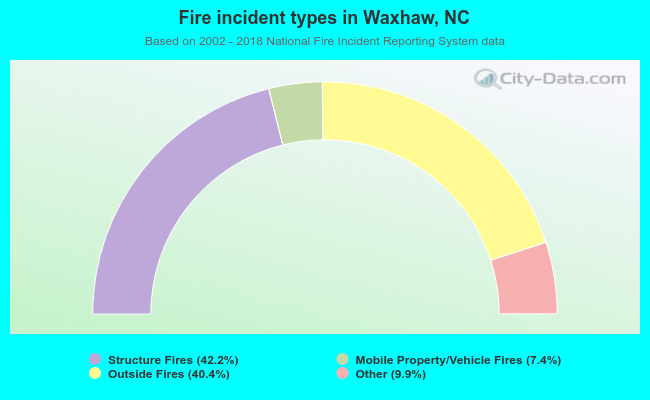 When looking into fire subcategories, the most reports belonged to: Structure Fires (42.2%), and Outside Fires (40.4%).