Waterford: Fire Incidents, California (CA)
Where are fire incidents reported in Waterford, CA
Something went wrong! Please refresh the page.
|
| |||||||||||||||||||||||||||||||||||||||||||||||||||||||||||||||||||||||||||||||||||||||||||||||||||||||||||||
2005 - 2018 National Fire Incident Reporting System (NFIRS) incidents
- Incident types reported to NFIRS in Waterford, CA
- 1,61059.3%Rescue & EMS
- 39514.6%Good Intent Call
- 32011.8%Fire
- 2308.5%Service Call
- 792.9%Hazardous Condition
- 692.5%False Alarm
- 70.3%Special Incident
- 30.1%Overpressure Rupture
- Fire incident types reported to NFIRS in Waterford, CA
- 17153.4%Outside Fires
- 9830.6%Structure Fires
- 3912.2%Mobile Property/Vehicle Fires
- 123.8%Other
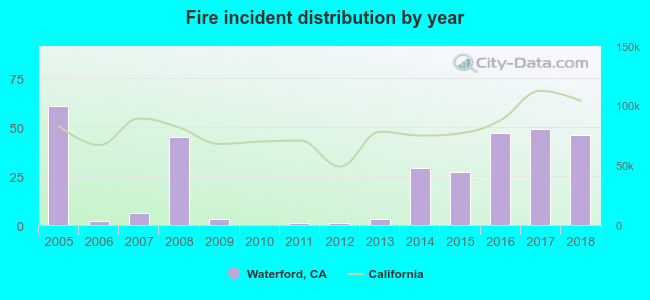 Based on the data from the years 2005 - 2018 the average number of fire incidents per year is 23. The highest number of reported fires - 61 took place in 2005, and the least - 0 in 2010. The data has a declining trend.
The average number of yearly fire incidents per 10k residents in Waterford, CA compared to nearest cities:
(Note: Based on data for the last 3 years, including only cities with population 5,000 and above)
| Waterford: | 54.2 |
| Hughson: | 25.4 |
| Oakdale: | 39.2 |
| Keyes: | 22.3 |
| Turlock: | 16.4 |
| Ceres: | 36.3 |
| Riverbank: | 32.8 |
| Modesto: | 68.9 |
| Delhi: | 81.2 |

 29.1% incidents where reported in the morning and 70.9% in the evening. The most fires (17.2%) took place on Saturday, and the least (10.0%) on Friday.
 According to the 320 fires from years 2005 - 2018 most fires (20.6%) took place during June, and the least (2.5%) in February.
 Out of all 2,714 cases reported during the years 2005 - 2018, the most belonged to the categories: Rescue & EMS (59.3%), Good Intent Call (14.6%), and Fire (11.8%).
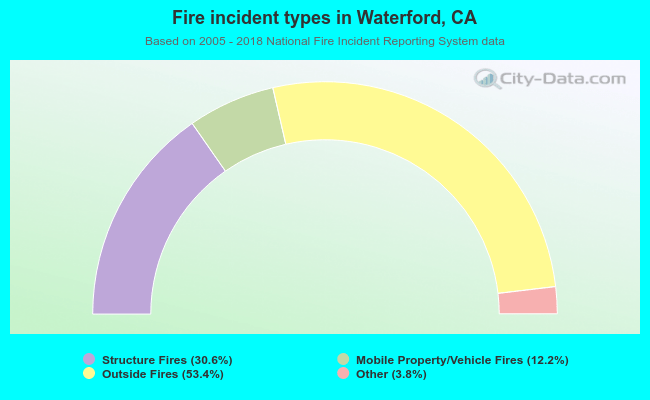 When looking into fire subcategories, the most incidents belonged to: Outside Fires (53.4%), and Structure Fires (30.6%).