Warrenton: Fire Incidents, Virginia (VA)
Where are fire incidents reported in Warrenton, VA
Something went wrong! Please refresh the page.
| Fire incidents reported | |
|---|---|
| Sreet name | Count |
| JAMES MADISON HWY | 220 |
| LEE HWY | 214 |
| BROADVIEW AVE | 88 |
| WEST LEE HWY | 76 |
| MEETZE RD | 68 |
| OPAL RD | 50 |
| WILSON RD | 46 |
| COMFORT INN DR | 42 |
| WATERLOO RD | 42 |
| AIRLIE RD | 38 |
| DUMFRIES RD | 38 |
| LEES RIDGE RD | 36 |
| HASTINGS LN | 34 |
| OLD WATERLOO RD | 34 |
| SPRINGS RD | 34 |
| BLACKWELL RD | 32 |
| LEEDS MANOR RD | 32 |
| BEAR WALLOW RD | 30 |
| WINCHESTER ST | 30 |
| MAIN ST | 28 |
| LEE HWY | 26 |
| BOTHA RD | 24 |
| FALMOUTH ST | 24 |
| FROST AVE | 24 |
| GREEN RD | 24 |
| HOSPITAL DR | 24 |
| HOLTZCLAW RD | 22 |
| LEES MILL RD | 22 |
| BEACH RD | 20 |
| BROAD RUN CHURCH RD | 20 |
| Other | 525 |
2002 - 2018 National Fire Incident Reporting System (NFIRS) incidents
- Incident types reported to NFIRS in Warrenton, VA
- 12,85962.4%Rescue & EMS
- 2,44711.9%Good Intent Call
- 2,32311.3%Hazardous Condition
- 1,9679.6%Fire
- 6323.1%Service Call
- 3341.6%False Alarm
- 230.1%Special Incident
- Fire incident types reported to NFIRS in Warrenton, VA
- 87044.2%Structure Fires
- 76438.8%Outside Fires
- 21410.9%Mobile Property/Vehicle Fires
- 1196.0%Other
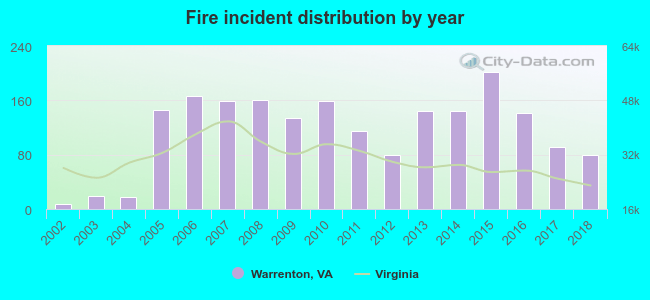 According to the data from the years 2002 - 2018 the average number of fires per year is 116. The highest number of reported fires - 201 took place in 2015, and the least - 8 in 2002. The data has a rising trend.
The average number of yearly fire incidents per 10k residents in Warrenton, VA compared to nearest cities:
(Note: Based on data for the last 3 years, including only cities with population 5,000 and above)
| Warrenton: | 105.3 |
| Gainesville: | 42.1 |
| Manassas: | 101.6 |
| Manassas Park: | 17.4 |
| Yorkshire: | 1.3 |
| Stone Ridge: | 1.4 |
| Culpeper: | 77.0 |
| Centreville: | 14.7 |
| South Riding: | 2.5 |
 The median response time based on all reported fire incidents is 8 minutes. This is close to the state median value.
The median response time in Warrenton, VA compared to nearest cities:
(Note: Based on data for all years, including only cities with at least 500 fire incidents)
| Warrenton: | 8 minutes |
| Bealeton: | 9 minutes |
| Marshall: | 11 minutes |
| Manassas: | 5 minutes |
| Manassas Park: | 4 minutes |
| Washington: | 6 minutes |
| Culpeper: | 13 minutes |
| Centreville: | 6 minutes |
| Chantilly: | 6 minutes |
 Based on the reports from the years 2002 - 2018 the average number of fire-related yearly deaths is 0. The highest number of deaths - 2 took place in 2011, and the lowest - 0 in 2002. The data has a constant trend.
 According to the data from the years 2002 - 2018 the average number of fire-related yearly casualties is 1. The highest number of casualties - 2 took place in 2005, and the lowest - 0 in 2002. The data has a constant trend.
The average number of casualties per 1,000 fire incidents is 3. This indicator was the highest - 14 in 2005, and the lowest 0 in 2002. The trend for casualties per 1,000 fires is rising. Compared to the Virginia value the number of casualties per 1,000 incidents is much lower.
According to the data from the years 2002 - 2018 the average number of fire-related yearly casualties is 1. The highest number of casualties - 2 took place in 2005, and the lowest - 0 in 2002. The data has a constant trend.
The average number of casualties per 1,000 fire incidents is 3. This indicator was the highest - 14 in 2005, and the lowest 0 in 2002. The trend for casualties per 1,000 fires is rising. Compared to the Virginia value the number of casualties per 1,000 incidents is much lower.Casualties per 1,000 incidents in Warrenton, VA compared to nearest cities:
(Note: Based on data for all years, including only cities with at least 500 fire incidents)
| Warrenton: | 4.6 |
| Bealeton: | 0.0 |
| Marshall: | 1.5 |
| Manassas: | 5.1 |
| Manassas Park: | 9.4 |
| Washington: | 0.8 |
| Culpeper: | 0.0 |
| Centreville: | 0.0 |
| Chantilly: | 4.3 |
 27.9% incidents where reported in the morning and 72.1% in the evening. The most fires (16.4%) took place on Saturday, and the least (12.8%) on Friday.
 Based on the 1,967 incident reports from years 2002 - 2018 most fires (13.0%) took place during March, and the least (5.6%) in September.
 Out of all 20,595 cases reported during the years 2002 - 2018, the most belonged to the categories: Rescue & EMS (62.4%), Good Intent Call (11.9%), and Hazardous Condition (11.3%).
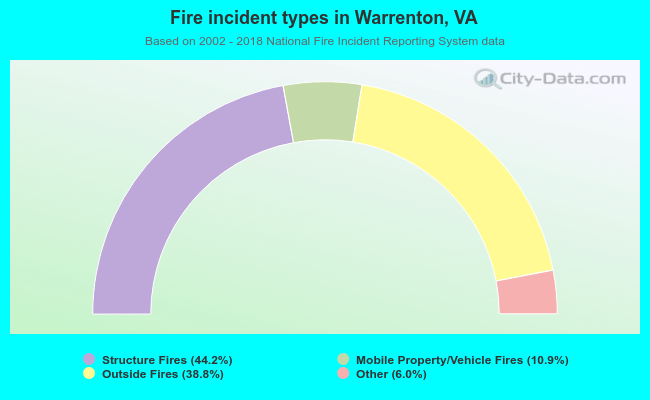 When looking into fire subcategories, the most reports belonged to: Structure Fires (44.2%), and Outside Fires (38.8%).