Warrensburg: Fire Incidents, Missouri (MO)
Where are fire incidents reported in Warrensburg, MO
Something went wrong! Please refresh the page.
| Fire incidents reported | |
|---|---|
| Sreet name | Count |
| 13 HWY | 214 |
| YOUNG ST | 142 |
| MAGUIRE ST | 132 |
| HOLDEN ST | 98 |
| 50 HWY | 96 |
| MARKET ST | 78 |
| CULTON ST | 76 |
| NORTH ST | 76 |
| CLARK ST | 66 |
| 101 RD | 64 |
| WASHINGTON ST | 54 |
| OO HWY | 52 |
| 21 RD | 50 |
| BB HWY | 50 |
| Y HWY | 50 |
| GAY ST | 48 |
| H HWY | 48 |
| MAIN ST | 48 |
| ANDERSON ST | 44 |
| E HWY | 44 |
| SOUTH ST | 44 |
| GROVER ST | 42 |
| RIDGEVIEW DR | 42 |
| 201 RD | 40 |
| ENTERPRISE AVE | 40 |
| 600 RD | 38 |
| BROAD ST | 38 |
| 251 RD | 36 |
| 400 RD | 36 |
| DD HWY | 36 |
| Other | 312 |
2002 - 2018 National Fire Incident Reporting System (NFIRS) incidents
- Incident types reported to NFIRS in Warrensburg, MO
- 3,59733.3%Hazardous Condition
- 2,55323.7%Rescue & EMS
- 2,23420.7%Fire
- 8307.7%False Alarm
- 8207.6%Service Call
- 6966.5%Good Intent Call
- 250.2%Special Incident
- 180.2%Severe Weather
- 170.2%Overpressure Rupture
- Fire incident types reported to NFIRS in Warrensburg, MO
- 1,02645.9%Outside Fires
- 80235.9%Structure Fires
- 33014.8%Mobile Property/Vehicle Fires
- 763.4%Other
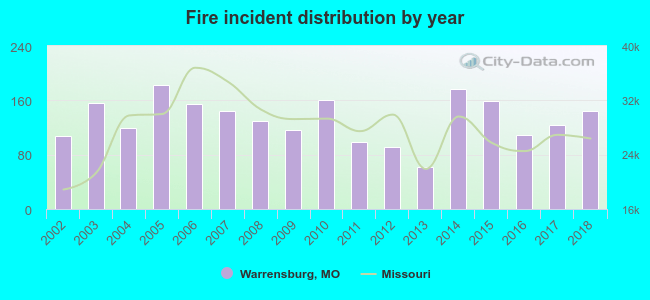 Based on the data from the years 2002 - 2018 the average number of fires per year is 131. The highest number of reported fires - 183 took place in 2005, and the least - 62 in 2013. The data has an increasing trend.
The average number of yearly fire incidents per 10k residents in Warrensburg, MO compared to nearest cities:
(Note: Based on data for the last 3 years, including only cities with population 5,000 and above)
| Warrensburg: | 62.9 |
| Odessa: | 127.6 |
| Oak Grove: | 48.7 |
| Clinton: | 83.6 |
| Sedalia: | 88.7 |
| Pleasant Hill: | 32.7 |
| Grain Valley: | 22.4 |
| Greenwood: | 23.1 |
| Harrisonville: | 7.0 |
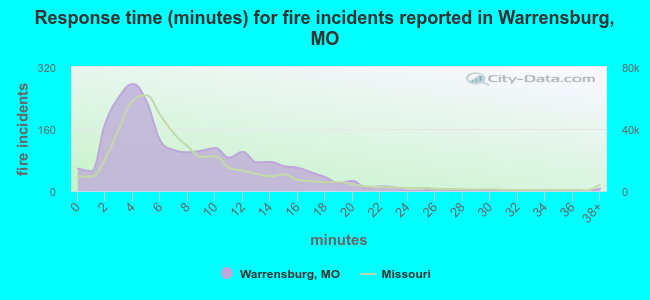 The median response time based on all reported fire incidents is 6 minutes. This is about the same as the state median value.
The median response time in Warrensburg, MO compared to nearest cities:
(Note: Based on data for all years, including only cities with at least 500 fire incidents)
| Warrensburg: | 6 minutes |
| Windsor: | 8 minutes |
| Odessa: | 9 minutes |
| Higginsville: | 8 minutes |
| Oak Grove: | 8 minutes |
| Clinton: | 8 minutes |
| Sedalia: | 5 minutes |
| Pleasant Hill: | 8 minutes |
| Lexington: | 7 minutes |
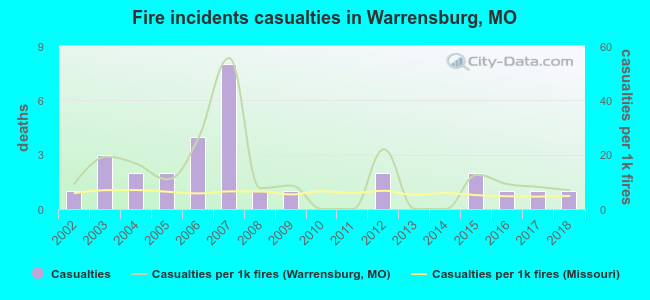 Based on the data from the years 2002 - 2018 the average number of fire-related casualties per year is 2. The highest number of reported injuries - 8 took place in 2007, and the lowest - 0 in 2010. The data has a constant trend.
The average number of injuries per 1,000 fire incidents is 13. This indicator was the highest - 56 in 2007, and the lowest 0 in 2010. The trend for injuries per 1,000 fires is declining. Compared to the state value the number of casualties per 1,000 fire incidents is much higher.
Based on the data from the years 2002 - 2018 the average number of fire-related casualties per year is 2. The highest number of reported injuries - 8 took place in 2007, and the lowest - 0 in 2010. The data has a constant trend.
The average number of injuries per 1,000 fire incidents is 13. This indicator was the highest - 56 in 2007, and the lowest 0 in 2010. The trend for injuries per 1,000 fires is declining. Compared to the state value the number of casualties per 1,000 fire incidents is much higher.Casualties per 1,000 incidents in Warrensburg, MO compared to nearest cities:
(Note: Based on data for all years, including only cities with at least 500 fire incidents)
| Warrensburg: | 13.0 |
| Windsor: | 0.0 |
| Odessa: | 0.9 |
| Higginsville: | 0.0 |
| Oak Grove: | 12.4 |
| Clinton: | 12.9 |
| Sedalia: | 5.0 |
| Pleasant Hill: | 13.8 |
| Lexington: | 4.4 |
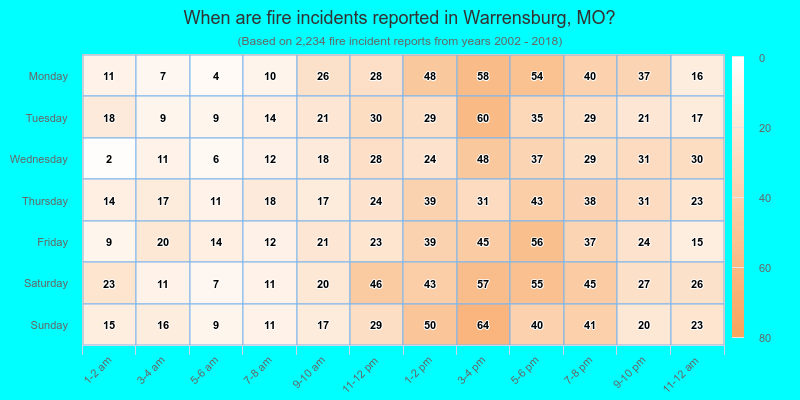
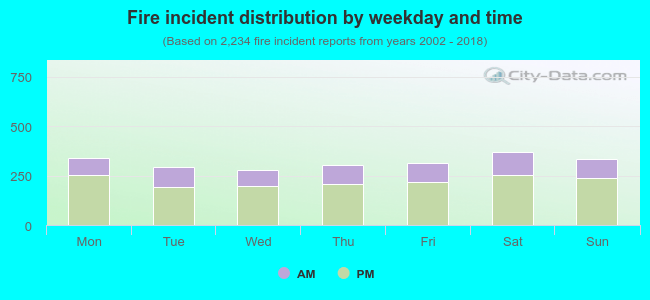 30.4% incidents where reported in the morning and 69.6% in the evening. The most fires (16.6%) took place on Saturday, and the least (12.4%) on Wednesday.
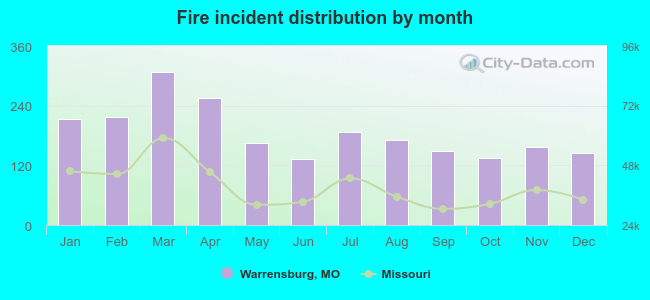 Based on the 2,234 fires from years 2002 - 2018 most fires (13.8%) took place during March, and the least (6.0%) in June.
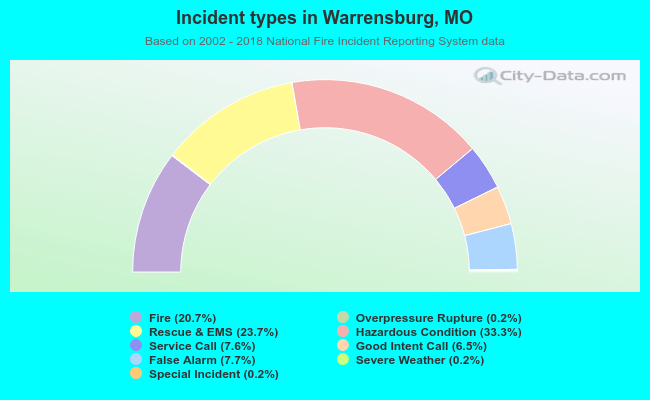 Out of all 10,790 cases reported during the years 2002 - 2018, the most belonged to the categories: Hazardous Condition (33.3%), Rescue & EMS (23.7%), and Fire (20.7%).
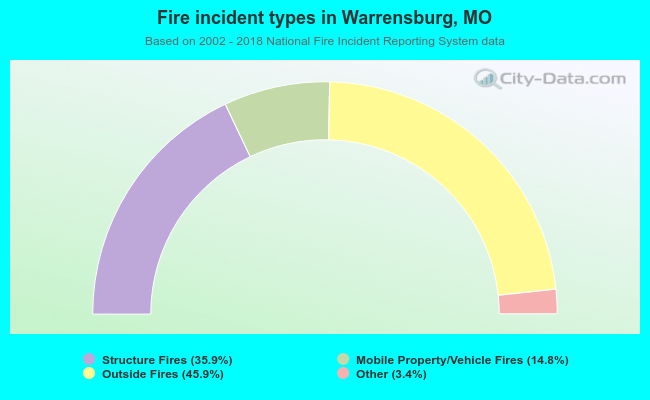 When looking into fire subcategories, the most reports belonged to: Outside Fires (45.9%), and Structure Fires (35.9%).