Vista: Fire Incidents, California (CA)
Where are fire incidents reported in Vista, CA
Something went wrong! Please refresh the page.
| Fire incidents reported | |
|---|---|
| Sreet name | Count |
| SANTA FE AVE | 348 |
| VISTA WAY | 304 |
| MELROSE DR | 276 |
| SYCAMORE AVE | 126 |
| OLIVE AVE | 94 |
| BOBIER DR | 90 |
| HACIENDA DR | 74 |
| VISTA VILLAGE DR | 72 |
| ASH ST | 66 |
| CALIFORNIA AVE | 62 |
| SUNSET DR | 62 |
| EMERALD DR | 60 |
| UNIVERSITY DR | 60 |
| SHADOWRIDGE DR | 58 |
| SR-78 WB | 56 |
| LOS ANGELES DR | 54 |
| OAK DR | 52 |
| VALE TERRACE DR | 50 |
| FOOTHILL DR | 48 |
| CEDAR RD | 46 |
| GOPHER CANYON RD | 46 |
| CALLE JULES | 44 |
| MEADOW LAKE DR | 42 |
| POSTAL WAY | 42 |
| SMILAX RD | 42 |
| SPECIALTY DR | 42 |
| SR-78 EB | 42 |
| ALTA VISTA DR | 40 |
| GRAPEVINE RD | 40 |
| MAIN ST | 40 |
| Other | 582 |
2005 - 2018 National Fire Incident Reporting System (NFIRS) incidents
- Incident types reported to NFIRS in Vista, CA
- 32,41064.1%Rescue & EMS
- 8,58517.0%Good Intent Call
- 3,8917.7%Service Call
- 3,0606.1%Fire
- 1,3622.7%Hazardous Condition
- 1,2122.4%False Alarm
- Fire incident types reported to NFIRS in Vista, CA
- 1,21139.6%Structure Fires
- 1,20239.3%Outside Fires
- 51216.7%Mobile Property/Vehicle Fires
- 1354.4%Other
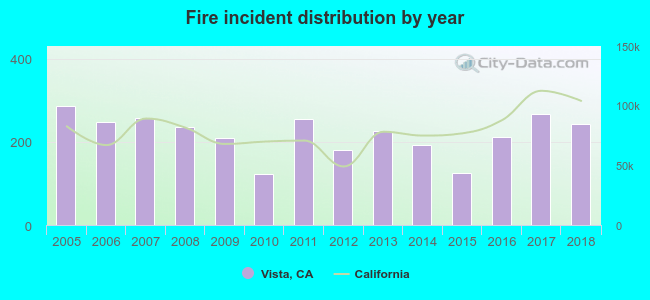 According to the data from the years 2005 - 2018 the average number of fires per year is 219. The highest number of fires - 287 took place in 2005, and the least - 123 in 2010. The data has a dropping trend.
The average number of yearly fire incidents per 10k residents in Vista, CA compared to nearest cities:
(Note: Based on data for the last 3 years, including only cities with population 5,000 and above)
| Vista: | 24.5 |
| Oceanside: | 18.4 |
| San Marcos: | 15.0 |
| Carlsbad: | 13.8 |
| Escondido: | 17.9 |
| Encinitas: | 12.4 |
| Fallbrook: | 36.7 |
| Valley Center: | 73.3 |
| Solana Beach: | 36.7 |
 The median response time based on all reported fire incidents is 6 minutes. This is close to the state median value.
The median response time in Vista, CA compared to nearest cities:
(Note: Based on data for all years, including only cities with at least 500 fire incidents)
| Vista: | 6 minutes |
| Oceanside: | 6 minutes |
| San Marcos: | 6 minutes |
| Carlsbad: | 6 minutes |
| Escondido: | 6 minutes |
| Encinitas: | 5 minutes |
| Rancho Santa Fe: | 6 minutes |
| Fallbrook: | 10 minutes |
| Ramona: | 5 minutes |
 According to the reports from the years 2005 - 2018 the average number of fire-related fatalities per year is 0. The highest number of reported deaths - 3 took place in 2005, and the lowest - 0 in 2007. The data has a decreasing trend.
The average number of deaths per 1,000 fire incidents is 2. This indicator was the highest - 10 in 2005, and the lowest 0 in 2007. The trend for fatalities per 1,000 fire incidents is declining. Compared to the California value the number of deaths per 1,000 fires is similar.
According to the reports from the years 2005 - 2018 the average number of fire-related fatalities per year is 0. The highest number of reported deaths - 3 took place in 2005, and the lowest - 0 in 2007. The data has a decreasing trend.
The average number of deaths per 1,000 fire incidents is 2. This indicator was the highest - 10 in 2005, and the lowest 0 in 2007. The trend for fatalities per 1,000 fire incidents is declining. Compared to the California value the number of deaths per 1,000 fires is similar.
 According to the reports from the years 2005 - 2018 the average number of fire-related yearly casualties is 3. The highest number of reported injuries - 10 took place in 2006, and the lowest - 0 in 2015. The data has a dropping trend.
The average number of injuries per 1,000 fires is 14. This indicator was the highest - 40 in 2006, and the lowest 0 in 2015. The trend for injuries per 1,000 fire incidents is dropping. Compared to the California value the number of injuries per 1,000 incidents is much higher.
According to the reports from the years 2005 - 2018 the average number of fire-related yearly casualties is 3. The highest number of reported injuries - 10 took place in 2006, and the lowest - 0 in 2015. The data has a dropping trend.
The average number of injuries per 1,000 fires is 14. This indicator was the highest - 40 in 2006, and the lowest 0 in 2015. The trend for injuries per 1,000 fire incidents is dropping. Compared to the California value the number of injuries per 1,000 incidents is much higher.Casualties per 1,000 incidents in Vista, CA compared to nearest cities:
(Note: Based on data for all years, including only cities with at least 500 fire incidents)
| Vista: | 14.4 |
| Oceanside: | 3.5 |
| San Marcos: | 26.8 |
| Carlsbad: | 0.7 |
| Escondido: | 25.9 |
| Encinitas: | 5.0 |
| Rancho Santa Fe: | 1.7 |
| Fallbrook: | 7.3 |
| Ramona: | 4.4 |
 33.6% incidents where reported in the morning and 66.4% in the evening. The most fires (15.9%) took place on Monday, and the least (13.2%) on Wednesday.
 According to the 3,060 incident reports from years 2005 - 2018 most fires (10.4%) took place during May, and the least (6.6%) in December.
 Out of all 50,557 cases reported during the years 2005 - 2018, the most belonged to the categories: Rescue & EMS (64.1%), Good Intent Call (17.0%), and Service Call (7.7%).
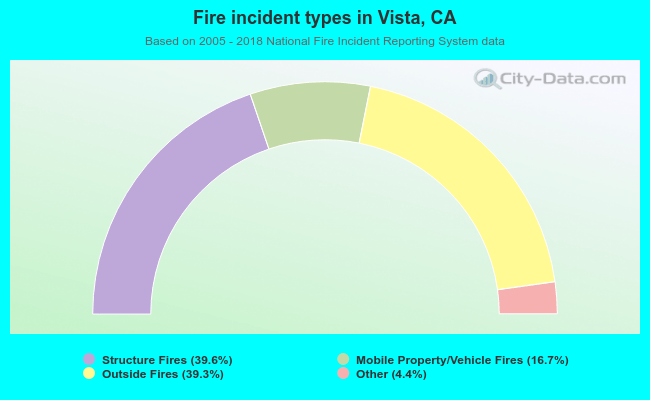 When looking into fire subcategories, the most incidents belonged to: Structure Fires (39.6%), and Outside Fires (39.3%).