Villa Rica: Fire Incidents, Georgia (GA)
Where are fire incidents reported in Villa Rica, GA
Something went wrong! Please refresh the page.
| Fire incidents reported | |
|---|---|
| Sreet name | Count |
| HIGHWAY 61 | 168 |
| I-20 | 138 |
| BANKHEAD HWY | 134 |
| CARROLLTON VILLA RICA HWY | 120 |
| HICKORY LEVEL RD | 112 |
| HARLAN LANE RD | 100 |
| ROCKMART RD | 84 |
| VAN WERT RD | 78 |
| I20 | 70 |
| VILLA RD | 70 |
| CONNERS RD | 66 |
| HIGHWAY 78 | 66 |
| LIBERTY RD | 66 |
| INDUSTRIAL BLVD | 64 |
| HIGHWAY 61 CONNECTOR | 54 |
| DALLAS HWY | 48 |
| FLAT ROCK RD | 44 |
| WILSON ST | 44 |
| SANDHILL HULETT RD | 42 |
| CARROLL RD | 40 |
| EVERGREEN DR | 38 |
| RIDGE DR | 38 |
| POPE RD | 36 |
| I20 WB FWY | 34 |
| ITHICA GIN RD | 34 |
| DANIEL RD | 32 |
| I20 EB FWY | 32 |
| INDUSTRIAL CT | 32 |
| LAKEVIEW PKY | 32 |
| THOMAS DORSEY DR | 30 |
| Other | 588 |
2002 - 2018 National Fire Incident Reporting System (NFIRS) incidents
- Incident types reported to NFIRS in Villa Rica, GA
- 10,62752.9%Rescue & EMS
- 2,53412.6%Fire
- 2,43512.1%Service Call
- 1,8699.3%Hazardous Condition
- 1,6358.1%Good Intent Call
- 8594.3%False Alarm
- 650.3%Severe Weather
- 560.3%Special Incident
- 270.1%Overpressure Rupture
- Fire incident types reported to NFIRS in Villa Rica, GA
- 1,27750.4%Outside Fires
- 77430.5%Structure Fires
- 46918.5%Mobile Property/Vehicle Fires
- 140.6%Other
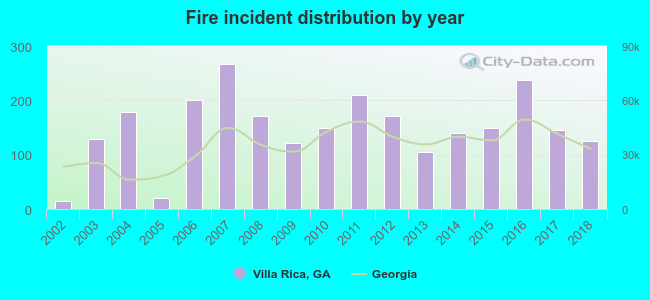 According to the data from the years 2002 - 2018 the average number of fire incidents per year is 149. The highest number of fires - 267 took place in 2007, and the least - 15 in 2002. The data has an increasing trend.
The average number of yearly fire incidents per 10k residents in Villa Rica, GA compared to nearest cities:
(Note: Based on data for the last 3 years, including only cities with population 5,000 and above)
| Villa Rica: | 115.0 |
| Winston: | 27.5 |
| Douglasville: | 66.4 |
| Bremen: | 159.5 |
| Dallas: | 203.0 |
| Carrollton: | 157.7 |
| Lithia Springs: | 44.3 |
| Powder Springs: | 65.1 |
| Austell: | 196.1 |
 The median response time based on all reported fire incidents is 7 minutes. This is similar to the state median value.
The median response time in Villa Rica, GA compared to nearest cities:
(Note: Based on data for all years, including only cities with at least 500 fire incidents)
| Villa Rica: | 7 minutes |
| Winston: | 7 minutes |
| Temple: | 7 minutes |
| Douglasville: | 6 minutes |
| Hiram: | 7 minutes |
| Bremen: | 6 minutes |
| Dallas: | 7 minutes |
| Carrollton: | 6 minutes |
| Lithia Springs: | 7 minutes |
 According to the data from the years 2002 - 2018 the average number of fire-related casualties per year is 2. The highest number of injuries - 5 took place in 2007, and the lowest - 0 in 2002. The data has a rising trend.
The average number of injuries per 1,000 fires is 16. This indicator was the highest - 48 in 2005, and the lowest 0 in 2002. The trend for injuries per 1,000 fires is growing. Compared to the Georgia value the number of casualties per 1,000 fire incidents is higher.
According to the data from the years 2002 - 2018 the average number of fire-related casualties per year is 2. The highest number of injuries - 5 took place in 2007, and the lowest - 0 in 2002. The data has a rising trend.
The average number of injuries per 1,000 fires is 16. This indicator was the highest - 48 in 2005, and the lowest 0 in 2002. The trend for injuries per 1,000 fires is growing. Compared to the Georgia value the number of casualties per 1,000 fire incidents is higher.Casualties per 1,000 incidents in Villa Rica, GA compared to nearest cities:
(Note: Based on data for all years, including only cities with at least 500 fire incidents)
| Villa Rica: | 14.6 |
| Winston: | 0.0 |
| Temple: | 3.6 |
| Douglasville: | 7.2 |
| Hiram: | 4.2 |
| Bremen: | 18.7 |
| Dallas: | 9.8 |
| Carrollton: | 8.0 |
| Lithia Springs: | 4.0 |
 26.5% incidents where reported in the morning and 73.5% in the evening. The most fires (16.1%) took place on Tuesday, and the least (12.9%) on Friday.
 According to the 2,534 fire incident reports from years 2002 - 2018 most fires (12.3%) took place during March, and the least (6.3%) in August.
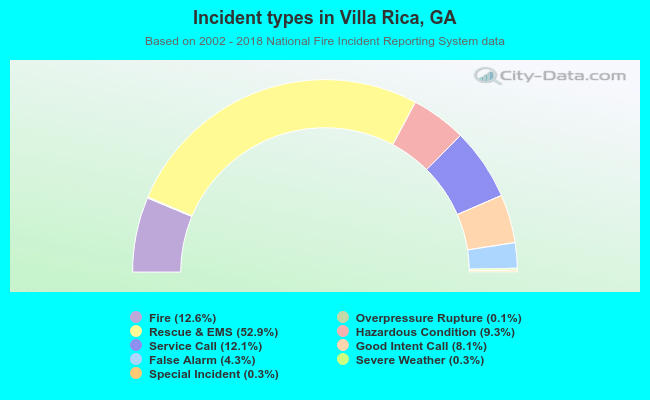 Out of all 20,107 cases reported during the years 2002 - 2018, the most belonged to the categories: Rescue & EMS (52.9%), Fire (12.6%), and Service Call (12.1%).
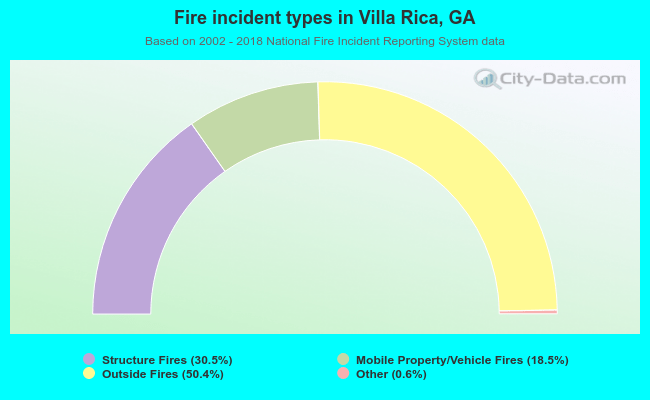 When looking into fire subcategories, the most incidents belonged to: Outside Fires (50.4%), and Structure Fires (30.5%).