Twin Falls: Fire Incidents, Idaho (ID)
Where are fire incidents reported in Twin Falls, ID
Something went wrong! Please refresh the page.
| Fire incidents reported | |
|---|---|
| Sreet name | Count |
| BLUE LAKES BLVD | 248 |
| ADDISON AVE | 170 |
| WASHINGTON ST | 164 |
| 2ND AVE | 146 |
| KIMBERLY RD | 114 |
| FILER AVE | 108 |
| FALLS AVE | 102 |
| 3RD AVE | 100 |
| 4TH AVE | 98 |
| MAIN AVE | 86 |
| POLE LINE RD | 80 |
| EASTLAND DR | 78 |
| LOCUST ST | 76 |
| 5TH AVE | 60 |
| HIGHLAND AVE | 58 |
| HARRISON ST | 56 |
| SHOSHONE ST | 48 |
| ROSE ST | 46 |
| ORCHARD DR | 44 |
| RUSSET ST | 42 |
| SUNRISE BLVD | 42 |
| ELDRIDGE AVE | 40 |
| HEYBURN AVE | 40 |
| OSTERLOH AVE | 40 |
| MADRONA ST | 38 |
| MONROE ST | 38 |
| 6TH AVE | 36 |
| BLAKE ST | 36 |
| CASWELL AVE | 36 |
| ELIZABETH BLVD | 34 |
2002 - 2018 National Fire Incident Reporting System (NFIRS) incidents
- Incident types reported to NFIRS in Twin Falls, ID
- 23,48359.9%Hazardous Condition
- 8,12720.7%Rescue & EMS
- 2,3786.1%Good Intent Call
- 2,1565.5%Fire
- 1,6094.1%False Alarm
- 1,1853.0%Service Call
- 2360.6%Special Incident
- Fire incident types reported to NFIRS in Twin Falls, ID
- 94043.6%Structure Fires
- 74534.6%Outside Fires
- 38417.8%Mobile Property/Vehicle Fires
- 874.0%Other
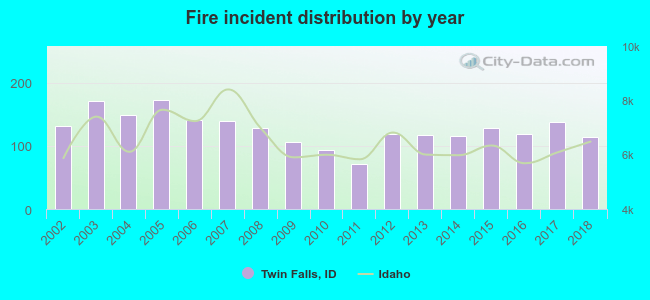 According to the data from the years 2002 - 2018 the average number of fires per year is 127. The highest number of reported fires - 172 took place in 2005, and the least - 72 in 2011. The data has a decreasing trend.
The average number of yearly fire incidents per 10k residents in Twin Falls, ID compared to nearest cities:
(Note: Based on data for the last 3 years, including only cities with population 5,000 and above)
| Twin Falls: | 26.6 |
| Jerome: | 129.3 |
| Burley: | 83.7 |
| Rupert: | 95.8 |
| Hailey: | 76.8 |
| Mountain Home: | 46.9 |
| Chubbuck: | 18.5 |
| Pocatello: | 25.5 |
| Moreland: | 1.0 |
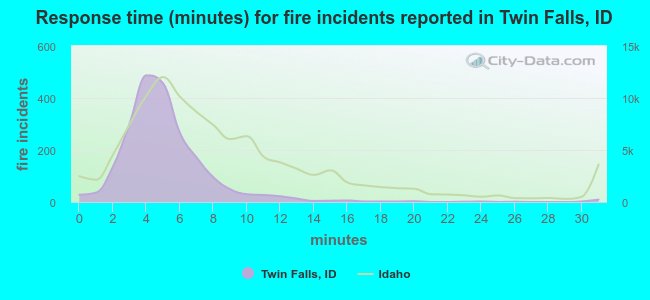 The median response time based on all reported fire incidents is 5 minutes. This is lower compared to the state median value.
The median response time in Twin Falls, ID compared to nearest cities:
(Note: Based on data for all years, including only cities with at least 500 fire incidents)
| Twin Falls: | 5 minutes |
| Kimberly: | 9 minutes |
| Filer: | 9 minutes |
| Jerome: | 7 minutes |
| Buhl: | 8 minutes |
| Wendell: | 8 minutes |
| Hagerman: | 11 minutes |
| Gooding: | 10 minutes |
| Burley: | 6 minutes |
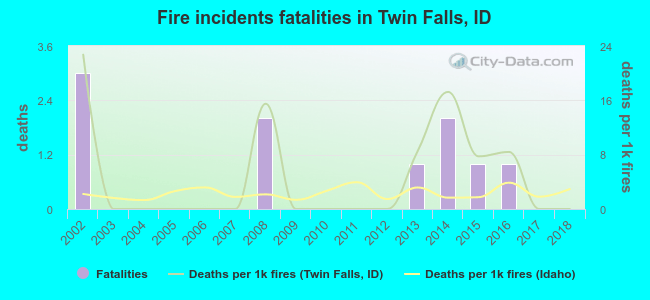 Based on the data from the years 2002 - 2018 the average number of fire-related yearly deaths is 1. The highest number of reported deaths - 3 took place in 2002, and the lowest - 0 in 2003. The data has a declining trend.
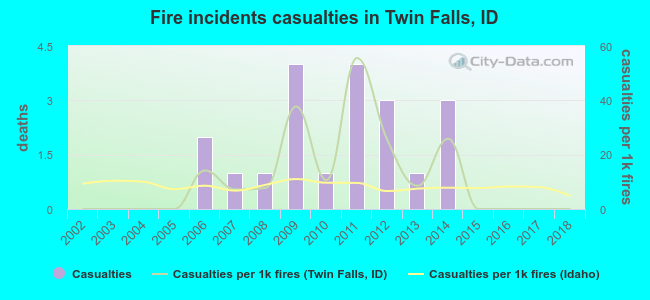 According to the reports from the years 2002 - 2018 the average number of fire-related casualties per year is 1. The highest number of casualties - 4 took place in 2009, and the lowest - 0 in 2002. The data has a constant trend.
The average number of injuries per 1,000 fires is 11. This indicator was the highest - 56 in 2011, and the lowest 0 in 2002. The trend for casualties per 1,000 incidents is declining. Compared to the Idaho value the number of casualties per 1,000 fire incidents is about the same.
According to the reports from the years 2002 - 2018 the average number of fire-related casualties per year is 1. The highest number of casualties - 4 took place in 2009, and the lowest - 0 in 2002. The data has a constant trend.
The average number of injuries per 1,000 fires is 11. This indicator was the highest - 56 in 2011, and the lowest 0 in 2002. The trend for casualties per 1,000 incidents is declining. Compared to the Idaho value the number of casualties per 1,000 fire incidents is about the same.
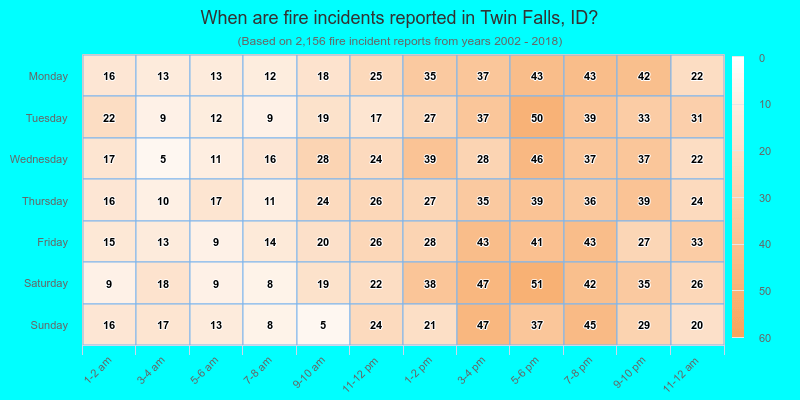
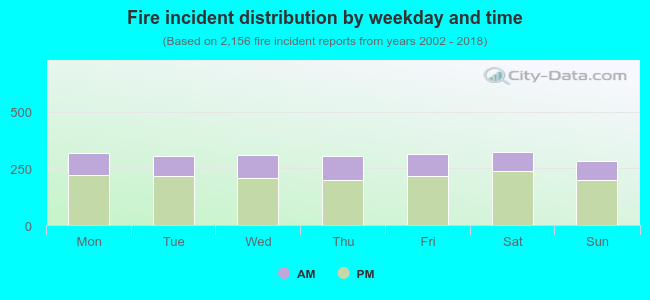 30.4% incidents where reported in the morning and 69.6% in the evening. The most fires (15.0%) took place on Saturday, and the least (13.1%) on Sunday.
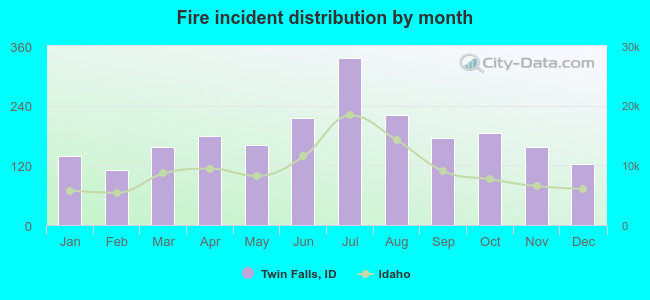 Based on the 2,156 fires from years 2002 - 2018 most fires (15.6%) took place during July, and the least (5.1%) in February.
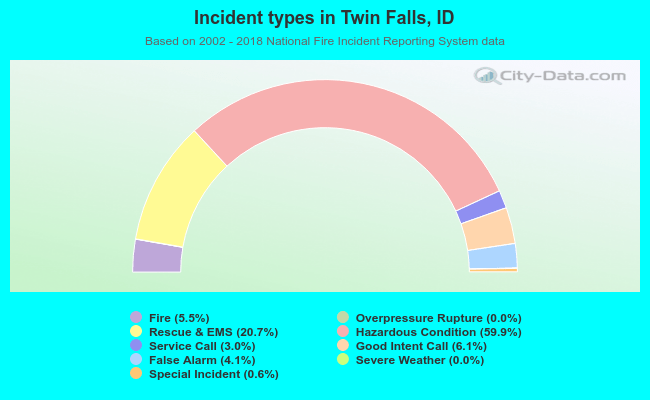 Out of all 39,199 cases reported during the years 2002 - 2018, the most belonged to the categories: Hazardous Condition (59.9%), Rescue & EMS (20.7%), and Good Intent Call (6.1%).
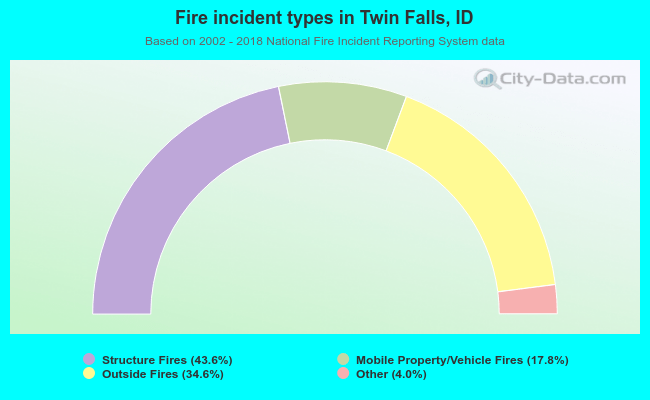 When looking into fire subcategories, the most incidents belonged to: Structure Fires (43.6%), and Outside Fires (34.6%).