Tracy: Fire Incidents, California (CA)
Where are fire incidents reported in Tracy, CA
Something went wrong! Please refresh the page.
| Fire incidents reported | |
|---|---|
| Sreet name | Count |
| GRANT LINE RD | 520 |
| TRACY BLVD | 498 |
| ELEVENTH ST | 418 |
| SCHULTE RD | 288 |
| CORRAL HOLLOW RD | 276 |
| I205 | 266 |
| KASSON RD | 256 |
| BYRON RD | 196 |
| MAC ARTHUR DR | 192 |
| LAMMERS RD | 180 |
| I580 | 170 |
| CHRISMAN RD | 162 |
| NAGLEE RD | 146 |
| LOWELL AVE | 132 |
| LINNE RD | 116 |
| HANSEN RD | 100 |
| BIRD RD | 96 |
| HOLLY DR | 92 |
| SIXTH ST | 80 |
| 205 | 78 |
| VALPICO RD | 78 |
| LINCOLN BLVD | 76 |
| I-5 FWY | 72 |
| LARCH RD | 72 |
| CENTRAL AVE | 70 |
| MOUNTAIN HOUSE PKY | 70 |
| CLOVER RD | 68 |
| NINTH ST | 64 |
| 580 | 60 |
| BETHANY RD | 60 |
| Other | 187 |
2005 - 2018 National Fire Incident Reporting System (NFIRS) incidents
- Incident types reported to NFIRS in Tracy, CA
- 16,27248.0%Rescue & EMS
- 6,76620.0%Good Intent Call
- 5,13915.2%Fire
- 2,0326.0%Hazardous Condition
- 2,0316.0%Service Call
- 1,6034.7%False Alarm
- Fire incident types reported to NFIRS in Tracy, CA
- 2,82855.0%Outside Fires
- 1,19323.2%Structure Fires
- 1,07020.8%Mobile Property/Vehicle Fires
- 480.9%Other
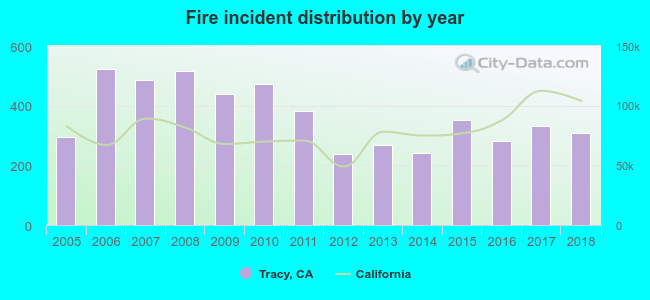 Based on the data from the years 2005 - 2018 the average number of fires per year is 367. The highest number of reported fires - 524 took place in 2006, and the least - 239 in 2012. The data has an increasing trend.
The average number of yearly fire incidents per 10k residents in Tracy, CA compared to nearest cities:
(Note: Based on data for the last 3 years, including only cities with population 5,000 and above)
| Tracy: | 35.8 |
| Mountain House: | 3.8 |
| Lathrop: | 70.6 |
| Manteca: | 59.8 |
| Discovery Bay: | 23.6 |
| Ripon: | 46.5 |
| Stockton: | 104.6 |
| Livermore: | 44.1 |
| Salida: | 6.6 |
 The median response time based on all reported fire incidents is 7 minutes. This is similar to the California median value.
The median response time in Tracy, CA compared to nearest cities:
(Note: Based on data for all years, including only cities with at least 500 fire incidents)
| Tracy: | 7 minutes |
| Lathrop: | 6 minutes |
| Manteca: | 5 minutes |
| Ripon: | 6 minutes |
| Stockton: | 5 minutes |
| Livermore: | 6 minutes |
| Brentwood: | 7 minutes |
| Oakley: | 7 minutes |
| Modesto: | 5 minutes |
 Based on the reports from the years 2005 - 2018 the average number of fire-related yearly casualties is 1. The highest number of reported casualties - 5 took place in 2013, and the lowest - 0 in 2005. The data has a growing trend.
The average number of casualties per 1,000 fires is 4. This indicator was the highest - 19 in 2013, and the lowest 0 in 2005. The trend for injuries per 1,000 incidents is increasing. Compared to the California value the number of casualties per 1,000 incidents is lower.
Based on the reports from the years 2005 - 2018 the average number of fire-related yearly casualties is 1. The highest number of reported casualties - 5 took place in 2013, and the lowest - 0 in 2005. The data has a growing trend.
The average number of casualties per 1,000 fires is 4. This indicator was the highest - 19 in 2013, and the lowest 0 in 2005. The trend for injuries per 1,000 incidents is increasing. Compared to the California value the number of casualties per 1,000 incidents is lower.
 31.1% incidents where reported in the morning and 68.9% in the evening. The most fires (15.1%) took place on Monday, and the least (13.6%) on Friday.
 According to the 5,139 fires from years 2005 - 2018 most fires (15.7%) took place during July, and the least (4.1%) in February.
 Out of all 33,901 cases reported during the years 2005 - 2018, the most belonged to the categories: Rescue & EMS (48.0%), Good Intent Call (20.0%), and Fire (15.2%).
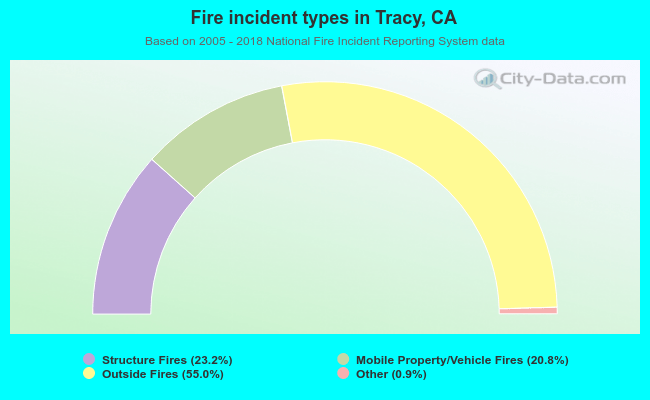 When looking into fire subcategories, the most reports belonged to: Outside Fires (55.0%), and Structure Fires (23.2%).