Temple: Fire Incidents, Texas (TX)
Where are fire incidents reported in Temple, TX
Something went wrong! Please refresh the page.
| Fire incidents reported | |
|---|---|
| Sreet name | Count |
| ADAMS AVE | 438 |
| 31ST ST | 434 |
| GENERAL BRUCE DR | 390 |
| H K DODGEN LP | 180 |
| 1ST ST | 174 |
| 5TH ST | 168 |
| 13TH ST | 132 |
| 2ND ST | 132 |
| 3RD ST | 132 |
| 4TH ST | 120 |
| H K DODGEN LOOP | 112 |
| 7TH ST | 106 |
| AIRPORT RD | 100 |
| CANYON CREEK DR | 94 |
| 9TH ST | 88 |
| MAIN ST | 86 |
| 39TH ST | 78 |
| 6TH ST | 72 |
| 15TH ST | 70 |
| K AVE | 68 |
| 12TH ST | 66 |
| 10TH ST | 64 |
| MARLANDWOOD RD | 64 |
| INDUSTRIAL BLVD | 62 |
| 25TH ST | 58 |
| MARTIN LUTHER KING JR DR | 56 |
| PEA RIDGE RD | 56 |
| 19TH ST | 52 |
| 11TH ST | 50 |
| NUGENT AVE | 50 |
| Other | 1,800 |
2002 - 2018 National Fire Incident Reporting System (NFIRS) incidents
- Incident types reported to NFIRS in Temple, TX
- 44,64461.0%Rescue & EMS
- 11,84716.2%Good Intent Call
- 5,5527.6%Fire
- 4,6686.4%Hazardous Condition
- 3,7555.1%Service Call
- 2,5633.5%False Alarm
- 970.1%Special Incident
- Fire incident types reported to NFIRS in Temple, TX
- 2,31041.6%Outside Fires
- 2,16038.9%Structure Fires
- 88415.9%Mobile Property/Vehicle Fires
- 1983.6%Other
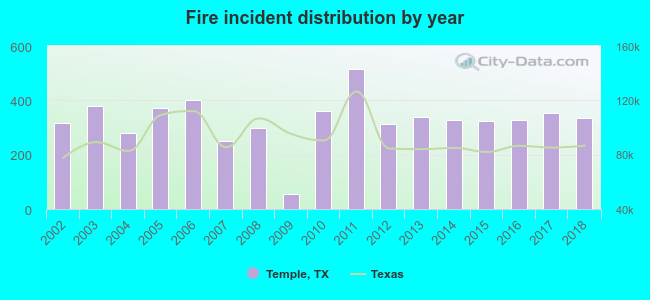 According to the data from the years 2002 - 2018 the average number of fires per year is 327. The highest number of fire incidents - 517 took place in 2011, and the least - 55 in 2009. The data has a growing trend.
The average number of yearly fire incidents per 10k residents in Temple, TX compared to nearest cities:
(Note: Based on data for the last 3 years, including only cities with population 5,000 and above)
| Temple: | 47.9 |
| Belton: | 41.4 |
| Harker Heights: | 32.6 |
| Killeen: | 35.7 |
| McGregor: | 8.6 |
| Fort Hood: | 0.7 |
| Hewitt: | 17.6 |
| Jarrell: | 52.8 |
| Cameron: | 87.7 |
 The median response time based on all reported fire incidents is 6 minutes. This is about the same as the Texas median value.
The median response time in Temple, TX compared to nearest cities:
(Note: Based on data for all years, including only cities with at least 500 fire incidents)
| Temple: | 6 minutes |
| Belton: | 7 minutes |
| Salado: | 9 minutes |
| Harker Heights: | 6 minutes |
| Killeen: | 6 minutes |
| Hewitt: | 7 minutes |
| Jarrell: | 7 minutes |
| Cameron: | 5 minutes |
| Robinson: | 9 minutes |
 Based on the data from the years 2002 - 2018 the average number of fire-related fatalities per year is 1. The highest number of reported deaths - 6 took place in 2004, and the lowest - 0 in 2003. The data has a dropping trend.
The average number of fatalities per 1,000 fires is 3. This indicator was the highest - 21 in 2004, and the lowest 0 in 2003. The trend for deaths per 1,000 fires is declining. Compared to the state value the number of deaths per 1,000 incidents is higher.
Based on the data from the years 2002 - 2018 the average number of fire-related fatalities per year is 1. The highest number of reported deaths - 6 took place in 2004, and the lowest - 0 in 2003. The data has a dropping trend.
The average number of fatalities per 1,000 fires is 3. This indicator was the highest - 21 in 2004, and the lowest 0 in 2003. The trend for deaths per 1,000 fires is declining. Compared to the state value the number of deaths per 1,000 incidents is higher.Deaths per 1,000 incidents in Temple, TX compared to nearest cities:
(Note: Based on data for all years, including only cities with at least 2,500 fire incidents)
| Temple: | 2.9 |
| Killeen: | 1.8 |
| Copperas Cove: | 1.1 |
| Gatesville: | 2.9 |
| Waco: | 3.1 |
| Georgetown: | 1.2 |
| Round Rock: | 0.7 |
 According to the reports from the years 2002 - 2018 the average number of fire-related casualties per year is 8. The highest number of injuries - 16 took place in 2016, and the lowest - 0 in 2008. The data has a decreasing trend.
The average number of injuries per 1,000 fires is 22. This indicator was the highest - 49 in 2016, and the lowest 0 in 2008. The trend for casualties per 1,000 fires is dropping. Compared to the state value the number of injuries per 1,000 fires is much higher.
According to the reports from the years 2002 - 2018 the average number of fire-related casualties per year is 8. The highest number of injuries - 16 took place in 2016, and the lowest - 0 in 2008. The data has a decreasing trend.
The average number of injuries per 1,000 fires is 22. This indicator was the highest - 49 in 2016, and the lowest 0 in 2008. The trend for casualties per 1,000 fires is dropping. Compared to the state value the number of injuries per 1,000 fires is much higher.
 29.5% incidents where reported in the morning and 70.5% in the evening. The most fires (15.7%) took place on Saturday, and the least (12.8%) on Tuesday.
 Based on the 5,552 reports from years 2002 - 2018 most fires (9.8%) took place during July, and the least (7.1%) in November.
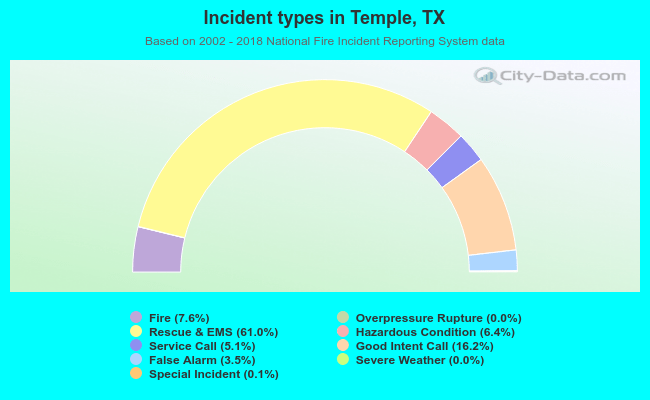 Out of all 73,178 cases reported during the years 2002 - 2018, the most belonged to the categories: Rescue & EMS (61.0%), Good Intent Call (16.2%), and Fire (7.6%).
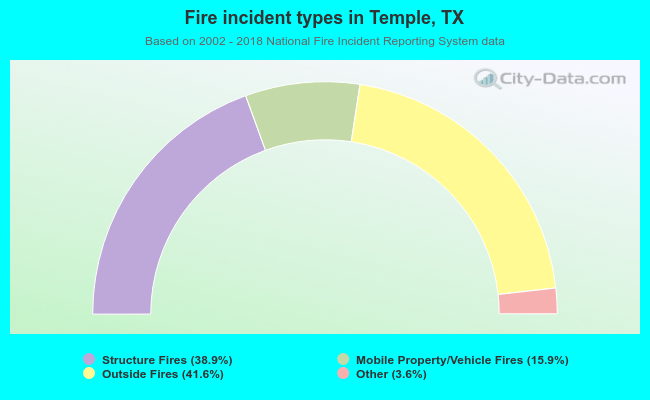 When looking into fire subcategories, the most reports belonged to: Outside Fires (41.6%), and Structure Fires (38.9%).