Sweetwater: Fire Incidents, Florida (FL)
Where are fire incidents reported in Sweetwater, FL
Something went wrong! Please refresh the page.
|
| |||||||||||||||||||||||||||||||||||||||||||||||||||||||||||||||||||||||||||||||||||||||||||||||||||||||||||||
2003 - 2018 National Fire Incident Reporting System (NFIRS) incidents
- Incident types reported to NFIRS in Sweetwater, FL
- 5,70883.9%Rescue & EMS
- 3395.0%Service Call
- 2583.8%Good Intent Call
- 1972.9%Fire
- 1612.4%Hazardous Condition
- 1412.1%False Alarm
- Fire incident types reported to NFIRS in Sweetwater, FL
- 11457.9%Structure Fires
- 4824.4%Outside Fires
- 3216.2%Mobile Property/Vehicle Fires
- 31.5%Other
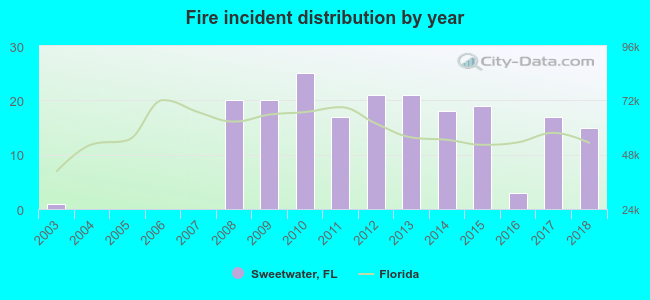 Based on the data from the years 2003 - 2018 the average number of fire incidents per year is 12. The highest number of fire incidents - 25 took place in 2010, and the least - 0 in 2004. The data has an increasing trend.
The average number of yearly fire incidents per 10k residents in Sweetwater, FL compared to nearest cities:
(Note: Based on data for the last 3 years, including only cities with population 5,000 and above)
| Sweetwater: | 7.6 |
| University Park: | 4.8 |
| Doral: | 11.9 |
| West Miami: | 11.6 |
| South Miami: | 15.9 |
| Miami Springs: | 12.0 |
| Coral Gables: | 13.7 |
| Hialeah Gardens: | 16.4 |
| Hialeah: | 7.0 |

 30.5% incidents where reported in the morning and 69.5% in the evening. The most fires (16.8%) took place on Monday, and the least (10.7%) on Friday.
 Based on the 197 fire incidents from years 2003 - 2018 most fires (10.7%) took place during September, and the least (6.1%) in April.
 Out of all 6,805 cases reported during the years 2003 - 2018, the most belonged to the categories: Overpressure Rupture (83.9%), Hazardous Condition (5.0%), and Service Call (3.8%).
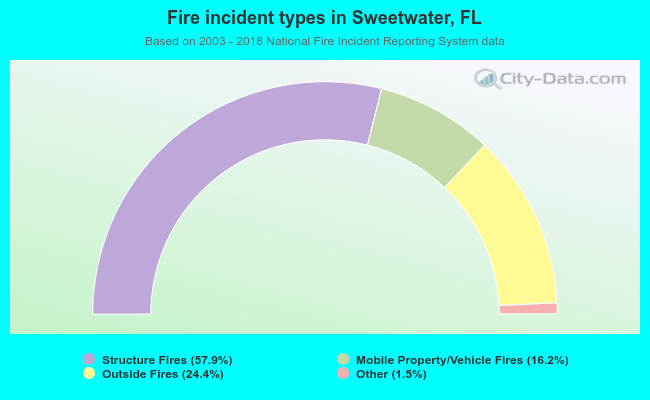 When looking into fire subcategories, the most incidents belonged to: Structure Fires (57.9%), and Outside Fires (24.4%).