Swainsboro: Fire Incidents, Georgia (GA)
Where are fire incidents reported in Swainsboro, GA
Something went wrong! Please refresh the page.
|
| |||||||||||||||||||||||||||||||||||||||||||||||||||||||||||||||||||||||||||||||||||||||||||||||||||||||||||||
| Other | 138 | |||||||||||||||||||||||||||||||||||||||||||||||||||||||||||||||||||||||||||||||||||||||||||||||||||||||||||||
2006 - 2018 National Fire Incident Reporting System (NFIRS) incidents
- Incident types reported to NFIRS in Swainsboro, GA
- 58830.3%Fire
- 57729.8%Rescue & EMS
- 34317.7%Hazardous Condition
- 23111.9%False Alarm
- 1467.5%Good Intent Call
- 442.3%Service Call
- 60.3%Severe Weather
- 30.2%Special Incident
- Fire incident types reported to NFIRS in Swainsboro, GA
- 23139.3%Outside Fires
- 20234.4%Structure Fires
- 10117.2%Mobile Property/Vehicle Fires
- 549.2%Other
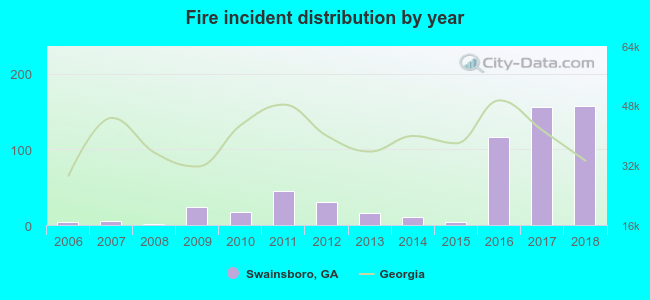 Based on the data from the years 2006 - 2018 the average number of fires per year is 45. The highest number of reported fires - 158 took place in 2018, and the least - 1 in 2008. The data has a rising trend.
The average number of yearly fire incidents per 10k residents in Swainsboro, GA compared to nearest cities:
(Note: Based on data for the last 3 years, including only cities with population 5,000 and above)
| Swainsboro: | 191.8 |
| Vidalia: | 35.9 |
| Statesboro: | 88.6 |
| Dublin: | 145.0 |
| Sandersville: | 128.6 |
| Waynesboro: | 184.2 |
 The median response time based on all reported fire incidents is 8 minutes. This is higher than the state median value.
The median response time in Swainsboro, GA compared to nearest cities:
(Note: Based on data for all years, including only cities with at least 500 fire incidents)
| Swainsboro: | 8 minutes |
| Wrightsville: | 10 minutes |
| Lyons: | 9 minutes |
| Millen: | 10 minutes |
| Louisville: | 5 minutes |
| East Dublin: | 7 minutes |
| Statesboro: | 6 minutes |
| Dublin: | 7 minutes |
| Reidsville: | 9 minutes |
 25.7% incidents where reported in the morning and 74.3% in the evening. The most fires (17.7%) took place on Friday, and the least (11.1%) on Tuesday.
 According to the 588 incident reports from years 2006 - 2018 most fires (15.1%) took place during March, and the least (5.1%) in December.
 Out of all 1,938 cases reported during the years 2006 - 2018, the most belonged to the categories: Fire (30.3%), Overpressure Rupture (29.8%), and Rescue & EMS (17.7%).
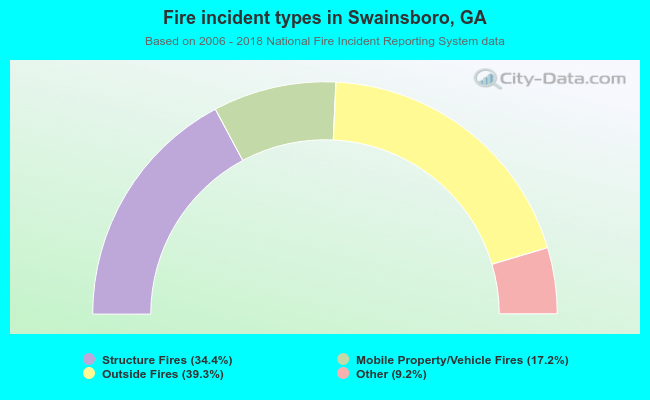 When looking into fire subcategories, the most incidents belonged to: Outside Fires (39.3%), and Structure Fires (34.4%).