Sunnyvale: Fire Incidents, Texas (TX)
Where are fire incidents reported in Sunnyvale, TX
Something went wrong! Please refresh the page.
|
| |||||||||||||||||||||||||||||||||||||||||||||||||||||||||||||||||||||||||||||||||||||||||||||||||||||||||||||
2002 - 2018 National Fire Incident Reporting System (NFIRS) incidents
- Incident types reported to NFIRS in Sunnyvale, TX
- 1,88055.2%Rescue & EMS
- 39811.7%Fire
- 38811.4%Hazardous Condition
- 2748.0%Good Intent Call
- 2266.6%Service Call
- 2246.6%False Alarm
- 80.2%Special Incident
- 50.1%Overpressure Rupture
- 50.1%Severe Weather
- Fire incident types reported to NFIRS in Sunnyvale, TX
- 21754.5%Outside Fires
- 9724.4%Structure Fires
- 7017.6%Mobile Property/Vehicle Fires
- 143.5%Other
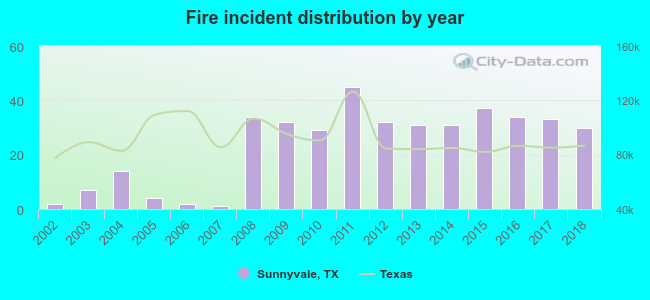 According to the data from the years 2002 - 2018 the average number of fire incidents per year is 23. The highest number of reported fire incidents - 45 took place in 2011, and the least - 1 in 2007. The data has a rising trend.
The average number of yearly fire incidents per 10k residents in Sunnyvale, TX compared to nearest cities:
(Note: Based on data for the last 3 years, including only cities with population 5,000 and above)
| Sunnyvale: | 56.1 |
| Mesquite: | 31.4 |
| Heath: | 31.3 |
| Balch Springs: | 39.0 |
| Forney: | 71.1 |
| Rowlett: | 17.9 |
| Garland: | 25.0 |
| Rockwall: | 23.0 |
| Seagoville: | 51.3 |

 27.1% incidents where reported in the morning and 72.9% in the evening. The most fires (18.1%) took place on Wednesday, and the least (10.1%) on Friday.
 According to the 398 incident reports from years 2002 - 2018 most fires (13.6%) took place during August, and the least (4.5%) in April.
 Out of all 3,408 cases reported during the years 2002 - 2018, the most belonged to the categories: Rescue & EMS (55.2%), Fire (11.7%), and Hazardous Condition (11.4%).
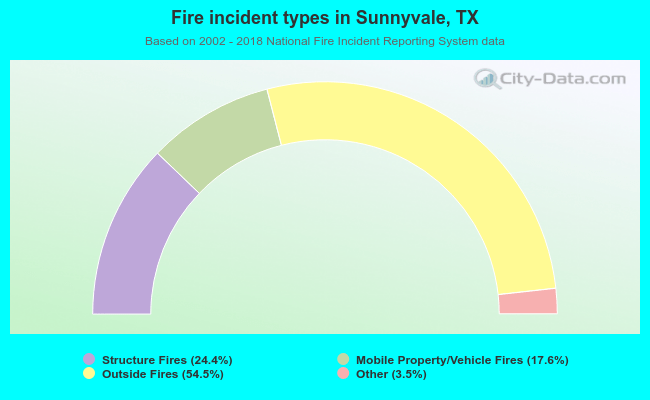 When looking into fire subcategories, the most reports belonged to: Outside Fires (54.5%), and Structure Fires (24.4%).