Suffield: Fire Incidents, Connecticut (CT)
Where are fire incidents reported in Suffield, CT
Something went wrong! Please refresh the page.
| Fire incidents reported | |
|---|---|
| Sreet name | Count |
| BRIDGE ST | 384 |
| MAPLETON AVE | 128 |
| CANAL RD | 112 |
| MOUNTAIN RD | 94 |
| STILES LN | 76 |
| NORTH MAIN ST | 62 |
| EAST ST | 60 |
| NORTH GRAND ST | 44 |
| NORTH ST | 40 |
| HILL ST | 34 |
| RUSSELL AVE | 34 |
| THOMPSONVILLE RD | 34 |
| BOSTON NECK RD | 30 |
| HALLADAY AVE | 30 |
| NEWGATE RD | 30 |
| SOUTH ST | 28 |
| SHELDON ST | 26 |
| HARVEY LN | 24 |
| AMBLESIDE CT | 22 |
| DOWNING WAY | 22 |
| SUFFIELD ST | 22 |
| MATHER ST | 18 |
| HALE ST | 16 |
| REMINGTON ST | 16 |
| RIVER BLVD | 16 |
| SOUTH MAIN ST | 16 |
| THRALL AVE | 16 |
| COPPER HILL RD | 14 |
| HALLADAYW AVE | 14 |
| EASTN ST | 12 |
2002 - 2018 National Fire Incident Reporting System (NFIRS) incidents
- Incident types reported to NFIRS in Suffield, CT
- 1,37330.5%Hazardous Condition
- 1,01122.5%Fire
- 87019.3%False Alarm
- 60213.4%Service Call
- 3698.2%Good Intent Call
- 1894.2%Rescue & EMS
- 691.5%Special Incident
- 90.2%Overpressure Rupture
- 80.2%Severe Weather
- Fire incident types reported to NFIRS in Suffield, CT
- 71971.1%Structure Fires
- 14714.5%Outside Fires
- 969.5%Mobile Property/Vehicle Fires
- 494.8%Other
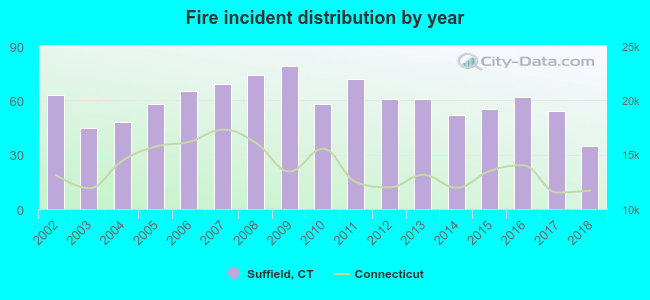 Based on the data from the years 2002 - 2018 the average number of fires per year is 59. The highest number of reported fires - 79 took place in 2009, and the least - 35 in 2018. The data has a decreasing trend.
The average number of yearly fire incidents per 10k residents in Suffield, CT compared to nearest cities:
(Note: Based on data for the last 3 years, including only cities with population 5,000 and above)
| Suffield: | 32.0 |
| Windsor Locks: | 41.3 |
| Enfield: | 58.1 |
| East Granby: | 93.2 |
| East Windsor: | 4.8 |
| Granby: | 28.4 |
| Windsor: | 48.0 |
| Somers: | 25.6 |
| Bloomfield: | 50.8 |
 The median response time based on all reported fire incidents is 5 minutes. This is similar to the Connecticut median value.
The median response time in Suffield, CT compared to nearest cities:
(Note: Based on data for all years, including only cities with at least 500 fire incidents)
| Suffield: | 5 minutes |
| Windsor Locks: | 6 minutes |
| Enfield: | 4 minutes |
| East Granby: | 7 minutes |
| Granby: | 7 minutes |
| Windsor: | 6 minutes |
| Somers: | 6 minutes |
| Bloomfield: | 6 minutes |
| Simsbury: | 5 minutes |
 Based on the reports from the years 2002 - 2018 the average number of fire-related yearly casualties is 1. The highest number of casualties - 6 took place in 2002, and the lowest - 0 in 2003. The data has a dropping trend.
The average number of casualties per 1,000 fire incidents is 25. This indicator was the highest - 95 in 2002, and the lowest 0 in 2003. The trend for casualties per 1,000 fires is decreasing. Compared to the state value the number of injuries per 1,000 incidents is much higher.
Based on the reports from the years 2002 - 2018 the average number of fire-related yearly casualties is 1. The highest number of casualties - 6 took place in 2002, and the lowest - 0 in 2003. The data has a dropping trend.
The average number of casualties per 1,000 fire incidents is 25. This indicator was the highest - 95 in 2002, and the lowest 0 in 2003. The trend for casualties per 1,000 fires is decreasing. Compared to the state value the number of injuries per 1,000 incidents is much higher.Casualties per 1,000 incidents in Suffield, CT compared to nearest cities:
(Note: Based on data for all years, including only cities with at least 500 fire incidents)
| Suffield: | 24.7 |
| Windsor Locks: | 13.6 |
| Enfield: | 14.8 |
| East Granby: | 9.0 |
| Granby: | 0.0 |
| Windsor: | 1.1 |
| Somers: | 33.8 |
| Bloomfield: | 26.3 |
| Simsbury: | 6.9 |
 28.9% incidents where reported in the morning and 71.1% in the evening. The most fires (16.8%) took place on Saturday, and the least (12.0%) on Wednesday.
 Based on the 1,011 reports from years 2002 - 2018 most fires (10.9%) took place during April, and the least (5.9%) in September.
 Out of all 4,500 cases reported during the years 2002 - 2018, the most belonged to the categories: Hazardous Condition (30.5%), Fire (22.5%), and False Alarm (19.3%).
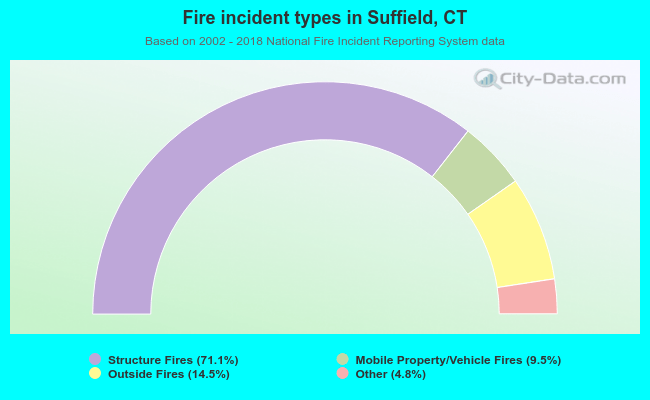 When looking into fire subcategories, the most incidents belonged to: Structure Fires (71.1%), and Outside Fires (14.5%).