St. Peters: Fire Incidents, Missouri (MO)
Where are fire incidents reported in St. Peters, MO
Something went wrong! Please refresh the page.
| Fire incidents reported | |
|---|---|
| Sreet name | Count |
| MID RIVERS MALL DR | 106 |
| MEXICO RD | 102 |
| JUNGERMAN RD | 62 |
| I-70 | 50 |
| PARK CHARLES BLVD | 48 |
| JUNGERMANN RD | 36 |
| MID RIVERS MALL (OCCUP) | 30 |
| HWY C | 26 |
| CHURCH ST | 24 |
| KIMBERLY LANE | 22 |
| VETERANS MEMORIAL PKY | 20 |
| MCCLAY RD | 18 |
| SERVICE RD | 18 |
| WOODRIDGE DR | 18 |
| HWY 79 | 16 |
| JULIE LANE | 16 |
| SALT LICK RD | 16 |
| BOONE HILLS DR | 14 |
| CAVE SPRINGS BLVD | 14 |
| ECOLOGY DR | 14 |
| JAMAICA DR | 14 |
| PLUM TREE DR | 14 |
| PEARL AVE | 12 |
| SUEMANDY DR | 12 |
| ATWATER DR | 10 |
| BIRDIE HILLS RD | 10 |
| CLOVERLEAF DR | 10 |
| COSTCO WAY | 10 |
| HACKMANN RD | 10 |
| HWY 370 | 10 |
| Other | 604 |
2002 - 2011 National Fire Incident Reporting System (NFIRS) incidents
- Incident types reported to NFIRS in St. Peters, MO
- 3,18839.7%Rescue & EMS
- 1,38617.3%Fire
- 1,18914.8%Hazardous Condition
- 91511.4%Good Intent Call
- 86510.8%False Alarm
- 4285.3%Service Call
- 220.3%Overpressure Rupture
- 220.3%Special Incident
- 190.2%Severe Weather
- Fire incident types reported to NFIRS in St. Peters, MO
- 56340.6%Structure Fires
- 49335.6%Outside Fires
- 23817.2%Mobile Property/Vehicle Fires
- 926.6%Other
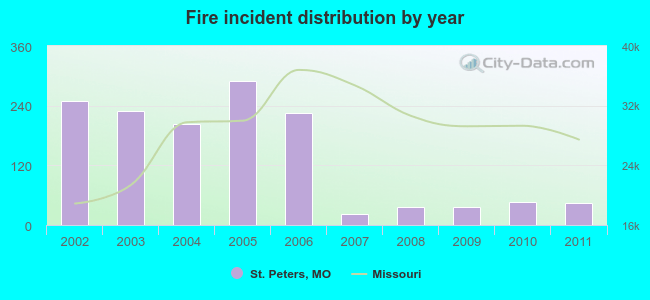 Based on the data from the years 2002 - 2011 the average number of fire incidents per year is 139. The highest number of fire incidents - 290 took place in 2005, and the least - 22 in 2007. The data has a declining trend.
 The median response time based on all reported fire incidents is 6 minutes. This is similar to the state median value.
The median response time in St. Peters, MO compared to nearest cities:
(Note: Based on data for all years, including only cities with at least 500 fire incidents)
| St. Peters: | 6 minutes |
| St. Charles: | 6 minutes |
| O'Fallon: | 5 minutes |
| Chesterfield: | 6 minutes |
| Maryland Heights: | 5 minutes |
| Bridgeton: | 5 minutes |
| Creve Coeur: | 6 minutes |
| Hazelwood: | 6 minutes |
| Ellisville: | 4 minutes |
 Based on the reports from the years 2002 - 2011 the average number of fire-related yearly casualties is 1. The highest number of reported injuries - 4 took place in 2003, and the lowest - 0 in 2006. The data has a declining trend.
The average number of injuries per 1,000 fire incidents is 8. This indicator was the highest - 27 in 2008, and the lowest 0 in 2006. The trend for casualties per 1,000 fires is declining. Compared to the state value the number of casualties per 1,000 incidents is higher.
Based on the reports from the years 2002 - 2011 the average number of fire-related yearly casualties is 1. The highest number of reported injuries - 4 took place in 2003, and the lowest - 0 in 2006. The data has a declining trend.
The average number of injuries per 1,000 fire incidents is 8. This indicator was the highest - 27 in 2008, and the lowest 0 in 2006. The trend for casualties per 1,000 fires is declining. Compared to the state value the number of casualties per 1,000 incidents is higher.Casualties per 1,000 incidents in St. Peters, MO compared to nearest cities:
(Note: Based on data for all years, including only cities with at least 500 fire incidents)
| St. Peters: | 9.4 |
| St. Charles: | 8.3 |
| O'Fallon: | 22.6 |
| Chesterfield: | 7.0 |
| Maryland Heights: | 4.0 |
| Bridgeton: | 3.0 |
| Creve Coeur: | 6.4 |
| Hazelwood: | 0.0 |
| Ellisville: | 12.1 |
 29.4% incidents where reported in the morning and 70.6% in the evening. The most fires (15.4%) took place on Sunday, and the least (13.0%) on Wednesday.
 According to the 1,386 fires from years 2002 - 2011 most fires (12.6%) took place during April, and the least (5.8%) in December.
 Out of all 8,034 cases reported during the years 2002 - 2011, the most belonged to the categories: Rescue & EMS (39.7%), Fire (17.3%), and Hazardous Condition (14.8%).
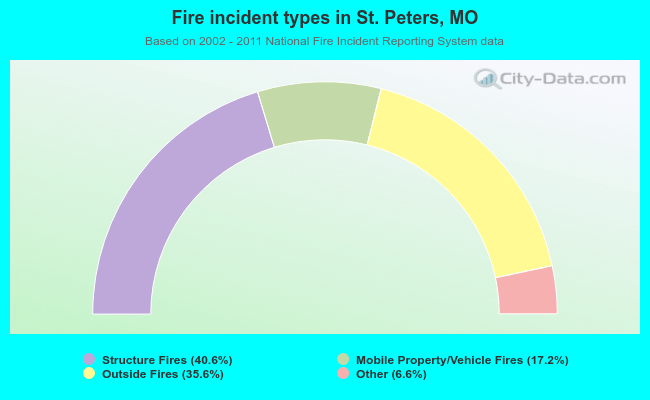 When looking into fire subcategories, the most incidents belonged to: Structure Fires (40.6%), and Outside Fires (35.6%).