Spotswood: Fire Incidents, New Jersey (NJ)
Where are fire incidents reported in Spotswood, NJ
Something went wrong! Please refresh the page.
|
| |||||||||||||||||||||||||||||||||||||||||||||||||||||||||||||||||||||||||||||||||||||||||||||||||||||||||||||
2002 - 2017 National Fire Incident Reporting System (NFIRS) incidents
- Incident types reported to NFIRS in Spotswood, NJ
- 17628.1%Hazardous Condition
- 13922.2%False Alarm
- 11618.5%Fire
- 9415.0%Service Call
- 599.4%Good Intent Call
- 345.4%Rescue & EMS
- 30.5%Overpressure Rupture
- 30.5%Special Incident
- 20.3%Severe Weather
- Fire incident types reported to NFIRS in Spotswood, NJ
- 5043.1%Structure Fires
- 4236.2%Outside Fires
- 1613.8%Other
- 86.9%Mobile Property/Vehicle Fires
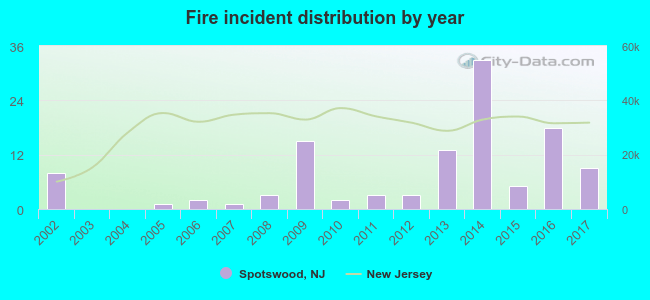 Based on the data from the years 2002 - 2017 the average number of fire incidents per year is 7. The highest number of reported fires - 33 took place in 2014, and the least - 0 in 2003. The data has a rising trend.
The average number of yearly fire incidents per 10k residents in Spotswood, NJ compared to nearest cities:
(Note: Based on data for the last 3 years, including only cities with population 5,000 and above)
| Spotswood: | 16.0 |
| East Brunswick: | 18.2 |
| Old Bridge: | 38.9 |
| South River: | 15.5 |
| Jamesburg: | 16.6 |
| Milltown: | 17.5 |
| Sayreville: | 11.2 |
| Morganville: | 36.4 |
| Dayton: | 16.0 |

 29.3% incidents where reported in the morning and 70.7% in the evening. The most fires (19.8%) took place on Monday, and the least (11.2%) on Thursday.
 According to the 116 fires from years 2002 - 2017 most fires (12.9%) took place during July, and the least (5.2%) in August.
 Out of all 626 cases reported during the years 2002 - 2017, the most belonged to the categories: Hazardous Condition (28.1%), False Alarm (22.2%), and Fire (18.5%).
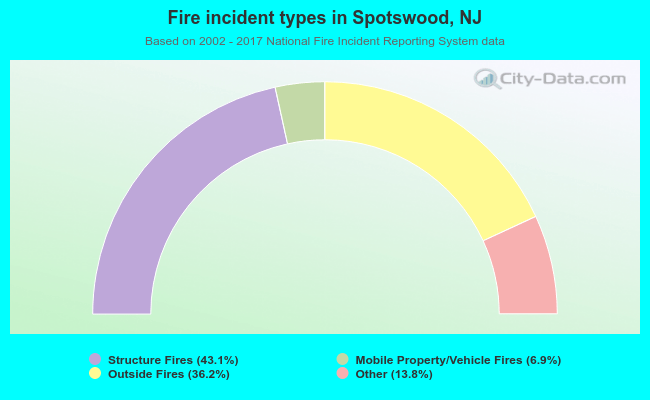 When looking into fire subcategories, the most incidents belonged to: Structure Fires (43.1%), and Outside Fires (36.2%).