Shirley: Fire Incidents, Massachusetts (MA)
Where are fire incidents reported in Shirley, MA
Something went wrong! Please refresh the page.
|
| |||||||||||||||||||||||||||||||||||||||||||||||||||||||||||||||||||||||||||||||||||||||||||||||||||||||||||||
2002 - 2018 National Fire Incident Reporting System (NFIRS) incidents
- Incident types reported to NFIRS in Shirley, MA
- 1,13057.1%Rescue & EMS
- 31716.0%Service Call
- 1929.7%Fire
- 1778.9%False Alarm
- 944.7%Good Intent Call
- 643.2%Hazardous Condition
- 30.2%Special Incident
- 20.1%Severe Weather
- Fire incident types reported to NFIRS in Shirley, MA
- 14072.9%Structure Fires
- 2814.6%Outside Fires
- 147.3%Mobile Property/Vehicle Fires
- 105.2%Other
 Based on the data from the years 2002 - 2018 the average number of fire incidents per year is 11. The highest number of fires - 36 took place in 2005, and the least - 1 in 2014. The data has a growing trend.
 According to the reports from the years 2002 - 2018 the average number of fire-related casualties per year is 0. The highest number of reported casualties - 3 took place in 2009, and the lowest - 0 in 2002. The data has a constant trend.
 46.9% incidents where reported in the morning and 53.1% in the evening. The most fires (18.2%) took place on Monday, and the least (9.9%) on Friday.
 According to the 192 reports from years 2002 - 2018 most fires (14.1%) took place during January, and the least (4.7%) in August.
 Out of all 1,979 cases reported during the years 2002 - 2018, the most belonged to the categories: Overpressure Rupture (57.1%), Hazardous Condition (16.0%), and Fire (9.7%).
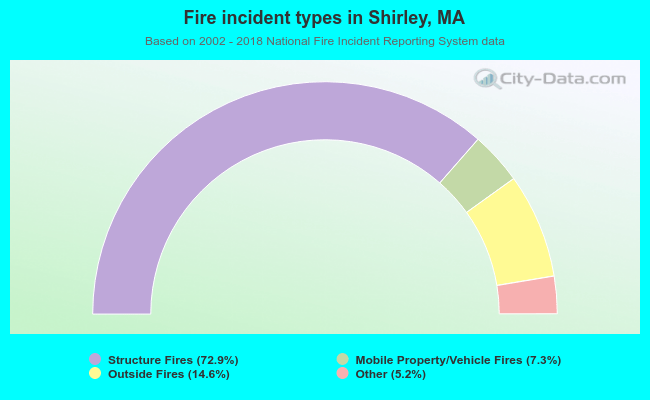 When looking into fire subcategories, the most incidents belonged to: Structure Fires (72.9%), and Outside Fires (14.6%).