Schaumburg: Fire Incidents, Illinois (IL)
Where are fire incidents reported in Schaumburg, IL
Something went wrong! Please refresh the page.
| Fire incidents reported | |
|---|---|
| Sreet name | Count |
| GOLF RD | 338 |
| ROSELLE RD | 236 |
| SCHAUMBURG RD | 224 |
| HIGGINS RD | 130 |
| ALGONQUIN RD | 96 |
| MEACHAM RD | 94 |
| WISE RD | 88 |
| SPRINGINSGUTH RD | 82 |
| WOODFIELD MALL | 66 |
| VALLEY LAKE DR | 62 |
| WOODFIELD RD | 60 |
| I90 | 56 |
| MARTINGALE RD | 54 |
| KNOLLWOOD DR | 52 |
| PLUM GROVE RD | 46 |
| AMERICAN LN | 40 |
| MALL DR | 40 |
| BARRINGTON RD | 36 |
| BEECH DR | 36 |
| SALEM DR | 32 |
| BODE RD | 30 |
| CAMBIA DR | 28 |
| REMINGTON RD | 28 |
| WALNUT LN | 28 |
| PERIMETER DR | 26 |
| PENNVIEW LN | 24 |
| DISCOVERY DR | 22 |
| MCCONNOR PKY | 20 |
| RODENBURG RD | 20 |
| SUMMIT DR | 20 |
| Other | 249 |
2003 - 2018 National Fire Incident Reporting System (NFIRS) incidents
- Incident types reported to NFIRS in Schaumburg, IL
- 28,56263.1%Rescue & EMS
- 6,07913.4%False Alarm
- 4,0188.9%Hazardous Condition
- 2,3635.2%Fire
- 2,2044.9%Good Intent Call
- 1,9804.4%Service Call
- Fire incident types reported to NFIRS in Schaumburg, IL
- 96640.9%Outside Fires
- 82034.7%Structure Fires
- 47119.9%Mobile Property/Vehicle Fires
- 1064.5%Other
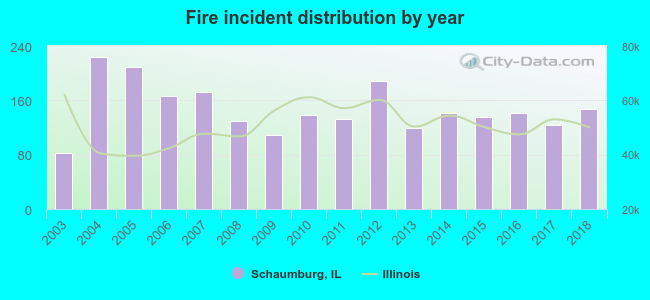 According to the data from the years 2003 - 2018 the average number of fires per year is 148. The highest number of reported fire incidents - 224 took place in 2004, and the least - 82 in 2003. The data has a growing trend.
The average number of yearly fire incidents per 10k residents in Schaumburg, IL compared to nearest cities:
(Note: Based on data for the last 3 years, including only cities with population 5,000 and above)
| Schaumburg: | 18.3 |
| Hoffman Estates: | 20.1 |
| Roselle: | 37.8 |
| Streamwood: | 21.8 |
| Rolling Meadows: | 23.9 |
| Hanover Park: | 24.4 |
| Elk Grove Village: | 36.0 |
| Itasca: | 53.8 |
| Bloomingdale: | 34.5 |
 The median response time based on all reported fire incidents is 5 minutes. This is about the same as the Illinois median value.
The median response time in Schaumburg, IL compared to nearest cities:
(Note: Based on data for all years, including only cities with at least 500 fire incidents)
| Schaumburg: | 5 minutes |
| Hoffman Estates: | 5 minutes |
| Roselle: | 6 minutes |
| Streamwood: | 5 minutes |
| Rolling Meadows: | 5 minutes |
| Hanover Park: | 4 minutes |
| Elk Grove Village: | 5 minutes |
| Itasca: | 6 minutes |
| Bloomingdale: | 5 minutes |
 According to the reports from the years 2003 - 2018 the average number of fire-related casualties per year is 1. The highest number of casualties - 4 took place in 2007, and the lowest - 0 in 2003. The data has a constant trend.
The average number of injuries per 1,000 fires is 10. This indicator was the highest - 34 in 2013, and the lowest 0 in 2003. The trend for injuries per 1,000 fire incidents is constant. Compared to the state value the number of injuries per 1,000 fires is about the same.
According to the reports from the years 2003 - 2018 the average number of fire-related casualties per year is 1. The highest number of casualties - 4 took place in 2007, and the lowest - 0 in 2003. The data has a constant trend.
The average number of injuries per 1,000 fires is 10. This indicator was the highest - 34 in 2013, and the lowest 0 in 2003. The trend for injuries per 1,000 fire incidents is constant. Compared to the state value the number of injuries per 1,000 fires is about the same.Casualties per 1,000 incidents in Schaumburg, IL compared to nearest cities:
(Note: Based on data for all years, including only cities with at least 500 fire incidents)
| Schaumburg: | 9.7 |
| Hoffman Estates: | 23.6 |
| Roselle: | 12.6 |
| Streamwood: | 15.0 |
| Rolling Meadows: | 19.4 |
| Hanover Park: | 36.5 |
| Elk Grove Village: | 14.2 |
| Itasca: | 13.4 |
| Bloomingdale: | 12.1 |
 29.0% incidents where reported in the morning and 71.0% in the evening. The most fires (15.7%) took place on Saturday, and the least (12.7%) on Thursday.
 Based on the 2,363 fires from years 2003 - 2018 most fires (12.9%) took place during July, and the least (5.8%) in February.
 Out of all 45,262 cases reported during the years 2003 - 2018, the most belonged to the categories: Rescue & EMS (63.1%), False Alarm (13.4%), and Hazardous Condition (8.9%).
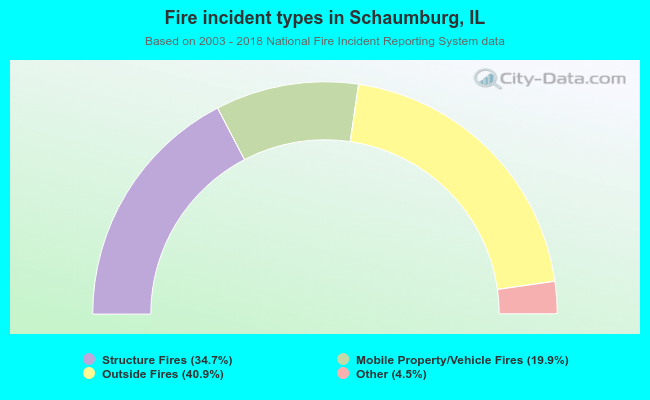 When looking into fire subcategories, the most incidents belonged to: Outside Fires (40.9%), and Structure Fires (34.7%).