Sandy: Fire Incidents, Utah (UT)
Where are fire incidents reported in Sandy, UT
Something went wrong! Please refresh the page.
| Fire incidents reported | |
|---|---|
| Sreet name | Count |
| STATE ST | 168 |
| 700 | 102 |
| 1300 | 60 |
| 9000 | 56 |
| 9400 | 38 |
| WASATCH BLVD | 38 |
| SEGO LILY DR | 34 |
| 300 | 30 |
| DIMPLE DELL RD | 28 |
| RIVERSIDE DR | 28 |
| 11400 | 24 |
| 500 | 24 |
| I-15 | 24 |
| 1000 | 22 |
| 10102 SOUTH 360 EAST | 22 |
| 10600 | 22 |
| HIGHLAND DR | 22 |
| 1700 | 20 |
| UNSPECIFIED | 20 |
| 11000 | 18 |
| 7800 | 18 |
| JORDAN VIEW DR | 18 |
| JULIE ANNA DR | 16 |
| UNION PARK AVE | 16 |
| 8680 | 14 |
| 9800 | 14 |
| BUTTERCUP DR | 14 |
| LITTLE COTTONWOOD RD | 14 |
| MONROE ST | 14 |
| 115 | 12 |
| Other | 1,413 |
2002 - 2018 National Fire Incident Reporting System (NFIRS) incidents
- Incident types reported to NFIRS in Sandy, UT
- 2,36327.4%Fire
- 1,85521.5%Hazardous Condition
- 1,59118.5%False Alarm
- 1,29615.0%Good Intent Call
- 1,05612.2%Service Call
- 3674.3%Rescue & EMS
- 380.4%Overpressure Rupture
- 350.4%Special Incident
- 210.2%Severe Weather
- Fire incident types reported to NFIRS in Sandy, UT
- 1,00242.4%Structure Fires
- 83835.5%Outside Fires
- 32113.6%Mobile Property/Vehicle Fires
- 2028.5%Other
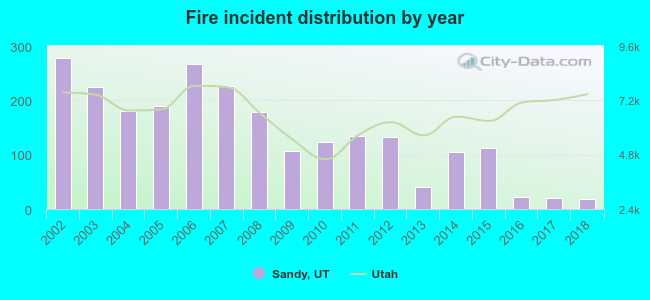 According to the data from the years 2002 - 2018 the average number of fires per year is 139. The highest number of fire incidents - 277 took place in 2002, and the least - 18 in 2018. The data has a declining trend.
The average number of yearly fire incidents per 10k residents in Sandy, UT compared to nearest cities:
(Note: Based on data for the last 3 years, including only cities with population 5,000 and above)
| Sandy: | 2.3 |
| Midvale: | 27.1 |
| Cottonwood Heights: | 14.6 |
| Draper: | 16.0 |
| South Jordan: | 9.0 |
| Murray: | 32.0 |
| Holladay: | 19.9 |
| Riverton: | 10.3 |
| West Jordan: | 11.0 |
 The median response time based on all reported fire incidents is 6 minutes. This is about the same as the Utah median value.
The median response time in Sandy, UT compared to nearest cities:
(Note: Based on data for all years, including only cities with at least 500 fire incidents)
| Sandy: | 6 minutes |
| Midvale: | 6 minutes |
| Cottonwood Heights: | 7 minutes |
| Draper: | 8 minutes |
| South Jordan: | 7 minutes |
| Murray: | 6 minutes |
| Holladay: | 7 minutes |
| Riverton: | 7 minutes |
| West Jordan: | 6 minutes |
 Based on the data from the years 2002 - 2018 the average number of fire-related fatalities per year is 1. The highest number of deaths - 2 took place in 2004, and the lowest - 0 in 2002. The data has a constant trend.
 Based on the reports from the years 2002 - 2018 the average number of fire-related yearly casualties is 3. The highest number of injuries - 10 took place in 2004, and the lowest - 0 in 2016. The data has a declining trend.
The average number of casualties per 1,000 fire incidents is 20. This indicator was the highest - 55 in 2004, and the lowest 0 in 2016. The trend for casualties per 1,000 incidents is dropping. Compared to the state value the number of injuries per 1,000 incidents is much higher.
Based on the reports from the years 2002 - 2018 the average number of fire-related yearly casualties is 3. The highest number of injuries - 10 took place in 2004, and the lowest - 0 in 2016. The data has a declining trend.
The average number of casualties per 1,000 fire incidents is 20. This indicator was the highest - 55 in 2004, and the lowest 0 in 2016. The trend for casualties per 1,000 incidents is dropping. Compared to the state value the number of injuries per 1,000 incidents is much higher.Casualties per 1,000 incidents in Sandy, UT compared to nearest cities:
(Note: Based on data for all years, including only cities with at least 500 fire incidents)
| Sandy: | 23.3 |
| Midvale: | 13.4 |
| Cottonwood Heights: | 14.7 |
| Draper: | 3.2 |
| South Jordan: | 10.1 |
| Murray: | 5.4 |
| Holladay: | 1.6 |
| Riverton: | 5.4 |
| West Jordan: | 14.4 |
 27.9% incidents where reported in the morning and 72.1% in the evening. The most fires (15.1%) took place on Tuesday, and the least (13.2%) on Sunday.
 According to the 2,363 fire incident reports from years 2002 - 2018 most fires (16.0%) took place during July, and the least (4.5%) in February.
 Out of all 8,622 cases reported during the years 2002 - 2018, the most belonged to the categories: Fire (27.4%), Hazardous Condition (21.5%), and False Alarm (18.5%).
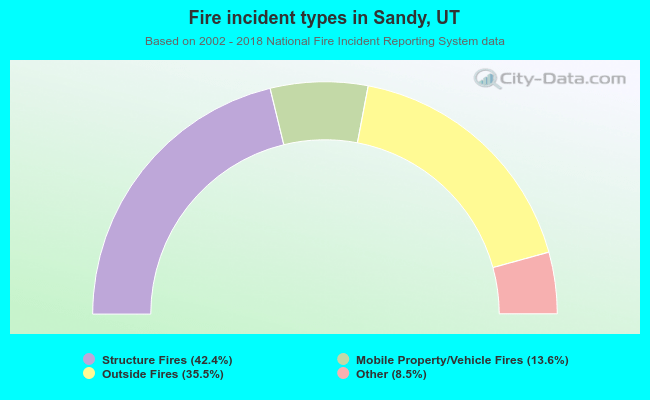 When looking into fire subcategories, the most reports belonged to: Structure Fires (42.4%), and Outside Fires (35.5%).