San Jacinto: Fire Incidents, California (CA)
Where are fire incidents reported in San Jacinto, CA
Something went wrong! Please refresh the page.
|
| |||||||||||||||||||||||||||||||||||||||||||||||||||||||||||||||||||||||||||||||||||||||||||||||||||||||||||||
2005 - 2018 National Fire Incident Reporting System (NFIRS) incidents
- Incident types reported to NFIRS in San Jacinto, CA
- 2,61083.8%Rescue & EMS
- 2056.6%Good Intent Call
- 1585.1%Fire
- 702.2%Service Call
- 431.4%False Alarm
- 280.9%Hazardous Condition
- Fire incident types reported to NFIRS in San Jacinto, CA
- 7245.6%Outside Fires
- 5635.4%Structure Fires
- 2213.9%Mobile Property/Vehicle Fires
- 85.1%Other
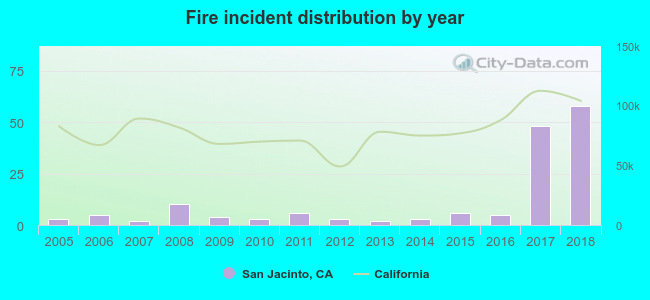 Based on the data from the years 2005 - 2018 the average number of fire incidents per year is 11. The highest number of reported fire incidents - 58 took place in 2018, and the least - 2 in 2007. The data has a rising trend.
The average number of yearly fire incidents per 10k residents in San Jacinto, CA compared to nearest cities:
(Note: Based on data for the last 3 years, including only cities with population 5,000 and above)
| San Jacinto: | 8.0 |
| Hemet: | 33.0 |
| Valle Vista: | 1.4 |
| Homeland: | 3.4 |
| Nuevo: | 3.9 |
| Beaumont: | 5.4 |
| Banning: | 12.8 |
| Menifee: | 1.0 |
| Cherry Valley: | 6.3 |

 29.7% incidents where reported in the morning and 70.3% in the evening. The most fires (20.3%) took place on Friday, and the least (6.3%) on Thursday.
 Based on the 158 fire incident reports from years 2005 - 2018 most fires (13.9%) took place during July, and the least (5.1%) in February.
 Out of all 3,114 cases reported during the years 2005 - 2018, the most belonged to the categories: Overpressure Rupture (83.8%), Service Call (6.6%), and Fire (5.1%).
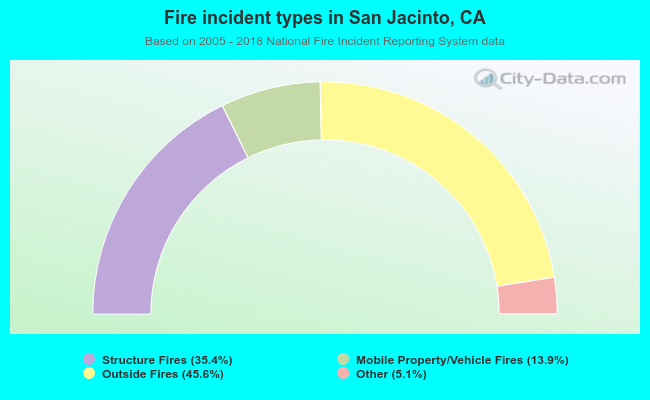 When looking into fire subcategories, the most reports belonged to: Outside Fires (45.6%), and Structure Fires (35.4%).