San Benito: Fire Incidents, Texas (TX)
Where are fire incidents reported in San Benito, TX
Something went wrong! Please refresh the page.
| Fire incidents reported | |
|---|---|
| Sreet name | Count |
| FM 732 | 224 |
| STENGER ST | 112 |
| FM 2520 | 108 |
| FM 1577 | 98 |
| BUSINESS 77 | 86 |
| FM 509 | 62 |
| NELSON RD | 60 |
| SAM HOUSTON | 60 |
| FM 510 | 56 |
| HIGHWAY 281 | 52 |
| HIGHWAY 77 | 52 |
| SAM HOUSTON BLVD | 50 |
| MCCULLOUGH ST | 48 |
| COMBES ST | 46 |
| EXPRESSWAY 83 | 44 |
| FM 800 | 44 |
| ESPINOZA RD | 40 |
| IOWA GARDENS RD | 38 |
| ROBERTSON ST | 36 |
| SAM HOUSTON ST | 36 |
| YOST RD | 34 |
| CASEY RD | 28 |
| FM 1846 | 28 |
| OSCAR WILLIAMS RD | 28 |
| STOOKEY RD | 28 |
| MAYFIELD RD | 26 |
| ZILLOCK RD | 26 |
| RATLIFF ST | 24 |
| TURNER ST | 22 |
| BONHAM ST | 20 |
| Other | 1,251 |
2004 - 2018 National Fire Incident Reporting System (NFIRS) incidents
- Incident types reported to NFIRS in San Benito, TX
- 2,86731.1%Fire
- 2,48827.0%Hazardous Condition
- 1,97321.4%Service Call
- 1,18812.9%Rescue & EMS
- 3804.1%Good Intent Call
- 2993.2%False Alarm
- Fire incident types reported to NFIRS in San Benito, TX
- 1,96468.5%Outside Fires
- 46416.2%Structure Fires
- 37613.1%Mobile Property/Vehicle Fires
- 632.2%Other
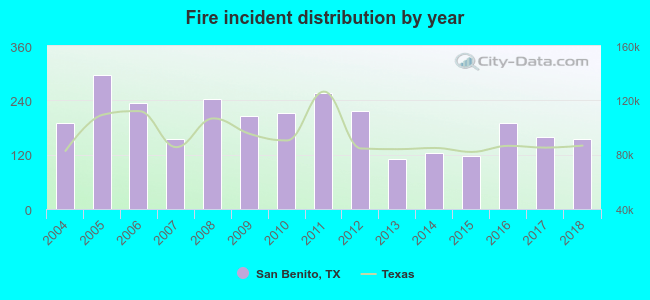 According to the data from the years 2004 - 2018 the average number of fire incidents per year is 191. The highest number of reported fire incidents - 296 took place in 2005, and the least - 111 in 2013. The data has a decreasing trend.
The average number of yearly fire incidents per 10k residents in San Benito, TX compared to nearest cities:
(Note: Based on data for the last 3 years, including only cities with population 5,000 and above)
| San Benito: | 68.7 |
| Lantana: | 3.4 |
| Harlingen: | 48.9 |
| Los Fresnos: | 120.5 |
| La Feria: | 14.1 |
| Cameron Park: | 2.9 |
| Brownsville: | 21.8 |
| Mercedes: | 51.4 |
| Progreso: | 28.4 |
 The median response time based on all reported fire incidents is 5 minutes. This is lower than the Texas median value.
The median response time in San Benito, TX compared to nearest cities:
(Note: Based on data for all years, including only cities with at least 500 fire incidents)
| San Benito: | 5 minutes |
| Harlingen: | 7 minutes |
| Los Fresnos: | 8 minutes |
| Brownsville: | 8 minutes |
| Mercedes: | 9 minutes |
| Weslaco: | 7 minutes |
 Based on the data from the years 2004 - 2018 the average number of fire-related yearly casualties is 0. The highest number of reported injuries - 2 took place in 2004, and the lowest - 0 in 2005. The data has a declining trend.
The average number of injuries per 1,000 fire incidents is 2. This indicator was the highest - 11 in 2004, and the lowest 0 in 2005. The trend for casualties per 1,000 fires is decreasing. Compared to the Texas value the number of injuries per 1,000 fires is much lower.
Based on the data from the years 2004 - 2018 the average number of fire-related yearly casualties is 0. The highest number of reported injuries - 2 took place in 2004, and the lowest - 0 in 2005. The data has a declining trend.
The average number of injuries per 1,000 fire incidents is 2. This indicator was the highest - 11 in 2004, and the lowest 0 in 2005. The trend for casualties per 1,000 fires is decreasing. Compared to the Texas value the number of injuries per 1,000 fires is much lower.Casualties per 1,000 incidents in San Benito, TX compared to nearest cities:
(Note: Based on data for all years, including only cities with at least 500 fire incidents)
| San Benito: | 1.4 |
| Harlingen: | 4.7 |
| Los Fresnos: | 0.0 |
| Brownsville: | 4.9 |
| Mercedes: | 3.6 |
| Weslaco: | 4.0 |
 27.2% incidents where reported in the morning and 72.8% in the evening. The most fires (15.0%) took place on Monday, and the least (13.0%) on Thursday.
 According to the 2,867 incident reports from years 2004 - 2018 most fires (10.1%) took place during January, and the least (5.5%) in September.
 Out of all 9,208 cases reported during the years 2004 - 2018, the most belonged to the categories: Fire (31.1%), Hazardous Condition (27.0%), and Service Call (21.4%).
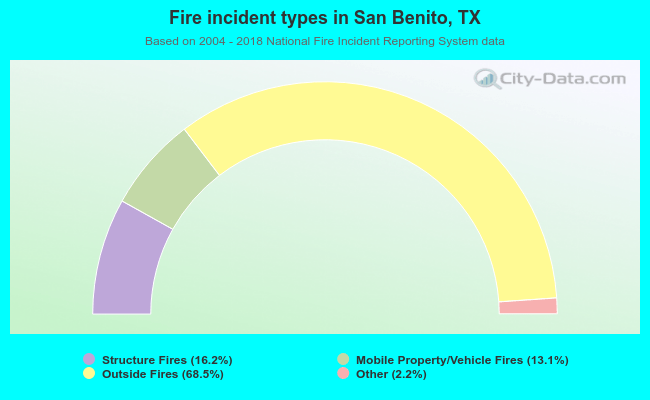 When looking into fire subcategories, the most reports belonged to: Outside Fires (68.5%), and Structure Fires (16.2%).