Rutland: Fire Incidents, Vermont (VT)
Where are fire incidents reported in Rutland, VT
Something went wrong! Please refresh the page.
| Fire incidents reported | |
|---|---|
| Sreet name | Count |
| TREMONT ST | 178 |
| WEST ST | 174 |
| SOUTH MAIN ST | 104 |
| ALLEN ST | 100 |
| MERCHANTS ROW | 88 |
| STATE ST | 88 |
| RIVER ST | 76 |
| GROVE ST | 74 |
| NORTH MAIN ST | 64 |
| PINE ST | 64 |
| PARK ST | 60 |
| CENTER ST | 56 |
| WOODSTOCK AVE | 56 |
| BAXTER ST | 52 |
| PARK AVE | 50 |
| STRATTON RD | 48 |
| CHURCH ST | 46 |
| TEMPLEWOOD CT | 46 |
| CURTIS AVE | 44 |
| NICHOLS ST | 42 |
| CRESCENT ST | 40 |
| CLEVELAND AVE | 38 |
| FOREST ST | 38 |
| JACKSON AVE | 38 |
| DORR DR | 36 |
| MEADOW ST | 36 |
| ROYCE ST | 36 |
| RUTLAND SHOPPING PLAZA | 36 |
| CLEMENT RD | 34 |
| COLUMBIAN AVE | 34 |
2002 - 2018 National Fire Incident Reporting System (NFIRS) incidents
- Incident types reported to NFIRS in Rutland, VT
- 2,67232.4%Hazardous Condition
- 1,80821.9%Fire
- 1,39716.9%Service Call
- 1,06912.9%False Alarm
- 5957.2%Rescue & EMS
- 5146.2%Good Intent Call
- 991.2%Severe Weather
- 881.1%Special Incident
- 130.2%Overpressure Rupture
- Fire incident types reported to NFIRS in Rutland, VT
- 1,14263.2%Structure Fires
- 45425.1%Outside Fires
- 1377.6%Mobile Property/Vehicle Fires
- 754.1%Other
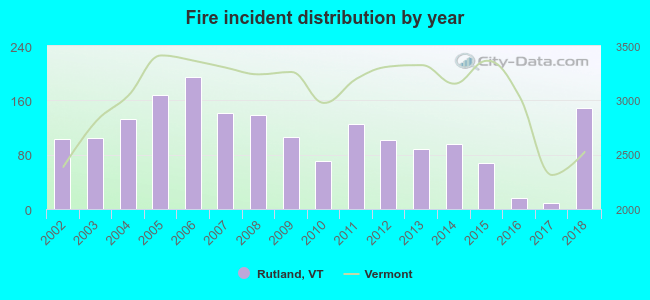 Based on the data from the years 2002 - 2018 the average number of fire incidents per year is 106. The highest number of reported fires - 194 took place in 2006, and the least - 9 in 2017. The data has a growing trend.
The average number of yearly fire incidents per 10k residents in Rutland, VT compared to nearest cities:
(Note: Based on data for the last 3 years, including only cities with population 5,000 and above)
| Rutland: | 36.4 |
| Middlebury: | 38.5 |
 The median response time based on all reported fire incidents is 3 minutes. This is much lower compared to the state median value.
The median response time in Rutland, VT compared to nearest cities:
(Note: Based on data for all years, including only cities with at least 500 fire incidents)
| Rutland: | 3 minutes |
 According to the reports from the years 2002 - 2018 the average number of fire-related fatalities per year is 0. The highest number of deaths - 2 took place in 2018, and the lowest - 0 in 2002. The data has a rising trend.
 Based on the reports from the years 2002 - 2018 the average number of fire-related casualties per year is 1. The highest number of reported injuries - 5 took place in 2003, and the lowest - 0 in 2002. The data has a constant trend.
The average number of injuries per 1,000 fire incidents is 18. This indicator was the highest - 111 in 2017, and the lowest 0 in 2002. The trend for casualties per 1,000 incidents is constant. Compared to the state value the number of casualties per 1,000 incidents is much higher.
Based on the reports from the years 2002 - 2018 the average number of fire-related casualties per year is 1. The highest number of reported injuries - 5 took place in 2003, and the lowest - 0 in 2002. The data has a constant trend.
The average number of injuries per 1,000 fire incidents is 18. This indicator was the highest - 111 in 2017, and the lowest 0 in 2002. The trend for casualties per 1,000 incidents is constant. Compared to the state value the number of casualties per 1,000 incidents is much higher.Casualties per 1,000 incidents in Rutland, VT compared to nearest cities:
(Note: Based on data for all years, including only cities with at least 500 fire incidents)
| Rutland: | 13.3 |
 33.3% incidents where reported in the morning and 66.7% in the evening. The most fires (15.4%) took place on Saturday, and the least (13.2%) on Sunday.
 Based on the 1,808 fire incident reports from years 2002 - 2018 most fires (12.0%) took place during April, and the least (6.2%) in August.
 Out of all 8,255 cases reported during the years 2002 - 2018, the most belonged to the categories: Hazardous Condition (32.4%), Fire (21.9%), and Service Call (16.9%).
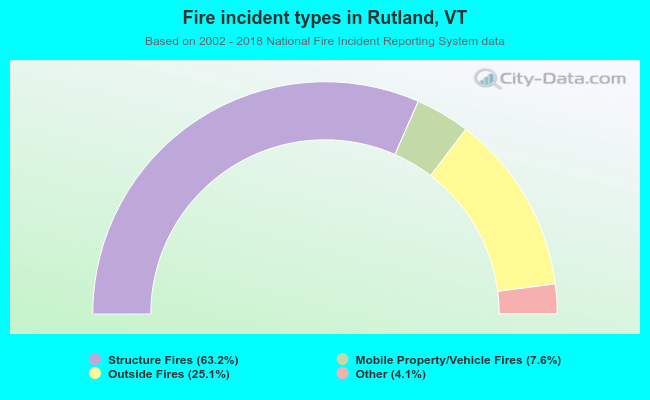 When looking into fire subcategories, the most reports belonged to: Structure Fires (63.2%), and Outside Fires (25.1%).